Fatigue limit diagrams according to Haigh or Smith show the maximum yieldable stress amplitude as a function of the mean stress.
Fatigue limit diagrams
Although the Wöhler curve is suitable for the evaluation of fatigue tests, it is not informative for the engineer. For example, a Wöhler curve only applies to a certain mean stress. With dynamically loaded components, however, the mean stress often changes in practice, which in turn influences the fatigue strength. In order to show the influence of the mean stress on the fatigue strength, many further curves for the most different mean stresses would have to be included in the stress-cycle diagram. The clarity would suffer greatly from this.
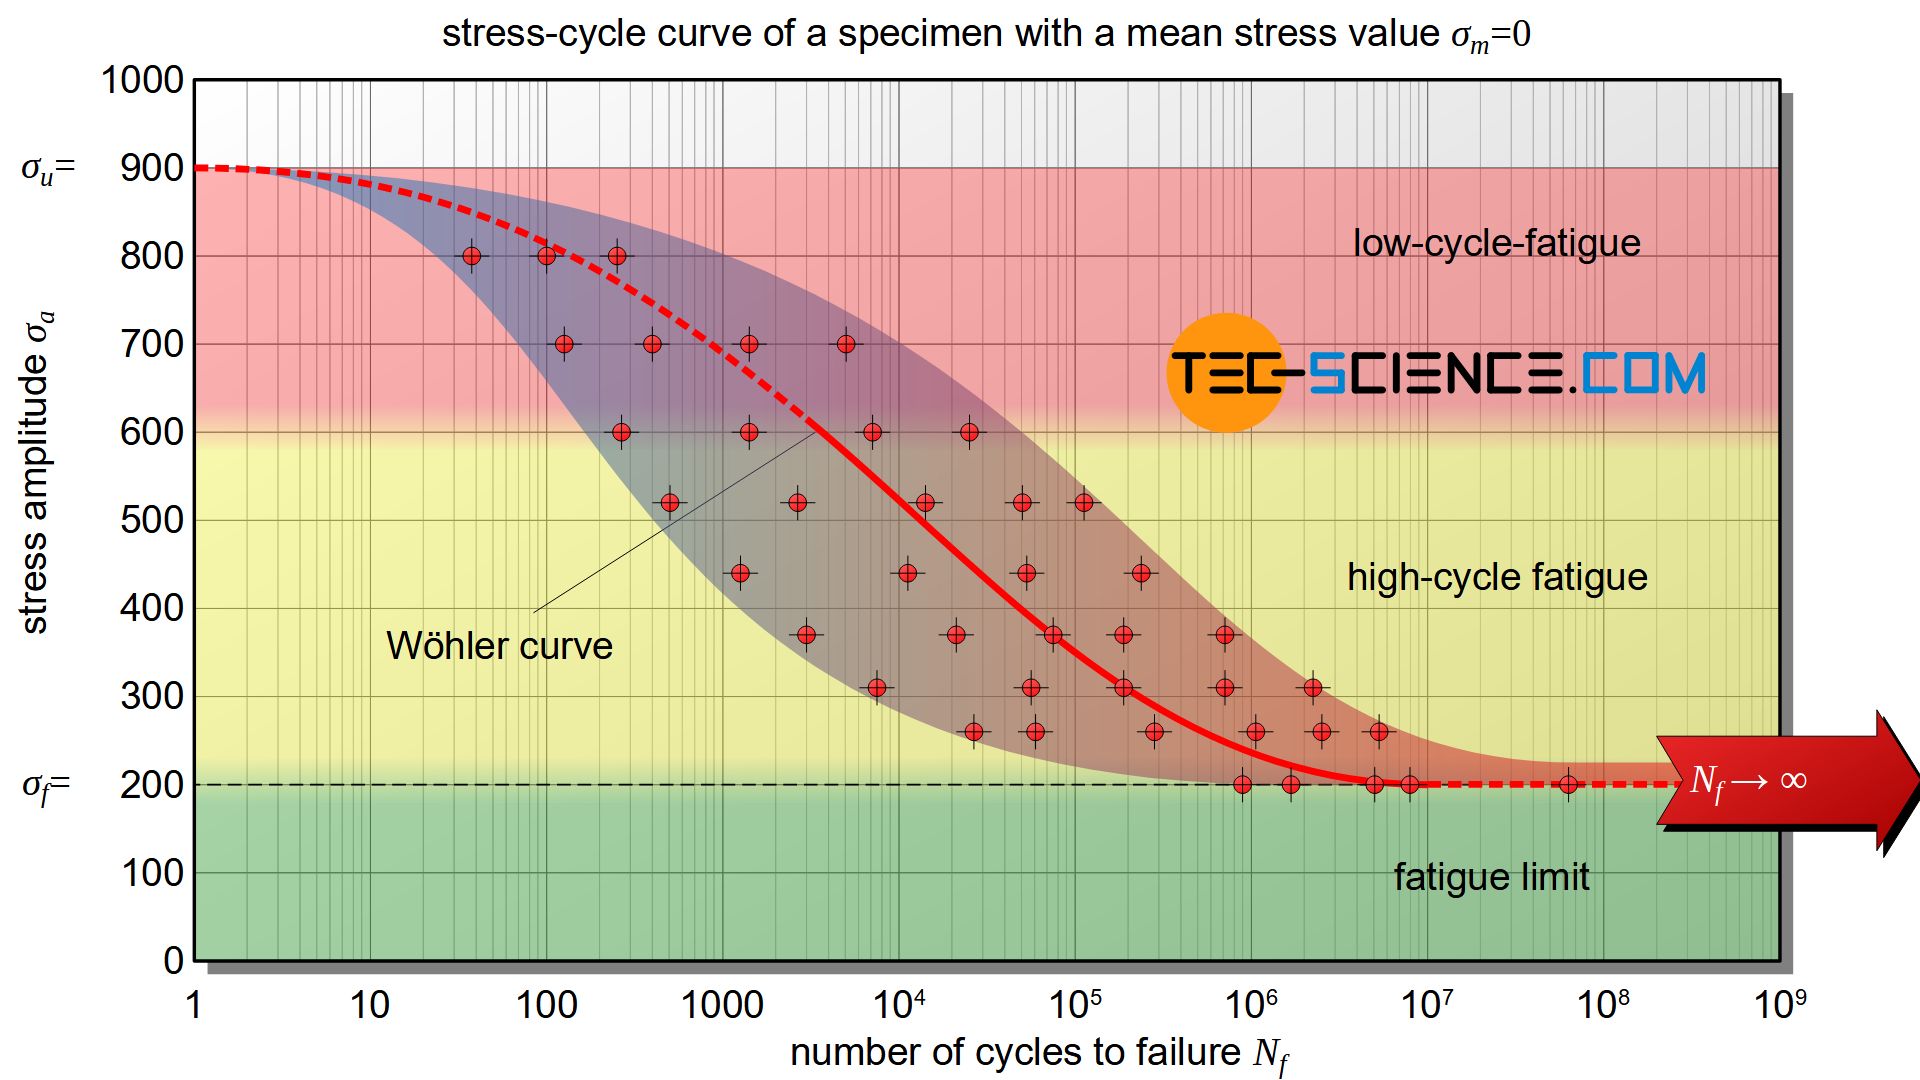
For this reason, special diagrams are used to illustrate the influence of the mean stress in a clearer way. The most important diagrams are those introduced by Haigh and Smith. If fatigue limit is taken as the basis in such diagrams, one speaks of fatigue limit diagrams. If, on the other hand, a certain number of load cycles to be endured is used as the basis, one speaks of fatigue strength diagrams.
Haigh Diagram (Goodman diagram)
In the fatigue limit diagram according to Haigh, the bearable stress amplitude is applied directly against the mean stress. Such a Haigh diagram is also referred to as a Goodman diagram. The intersection of the curve with the vertical axis corresponds to the alternating fatigue limit\(\sigma_{fa}\), since the mean stress there is zero (stress ratio \(R=-1\)). The intersection of the curve with the horizontal axis, however, can be interpreted as ultimate tensile strength \(\sigma_u\), since the specimen would theoretically fracture without an existing stress amplitude, i.e. solely due to the applied mean stress (stress ratio \(R=1\)).
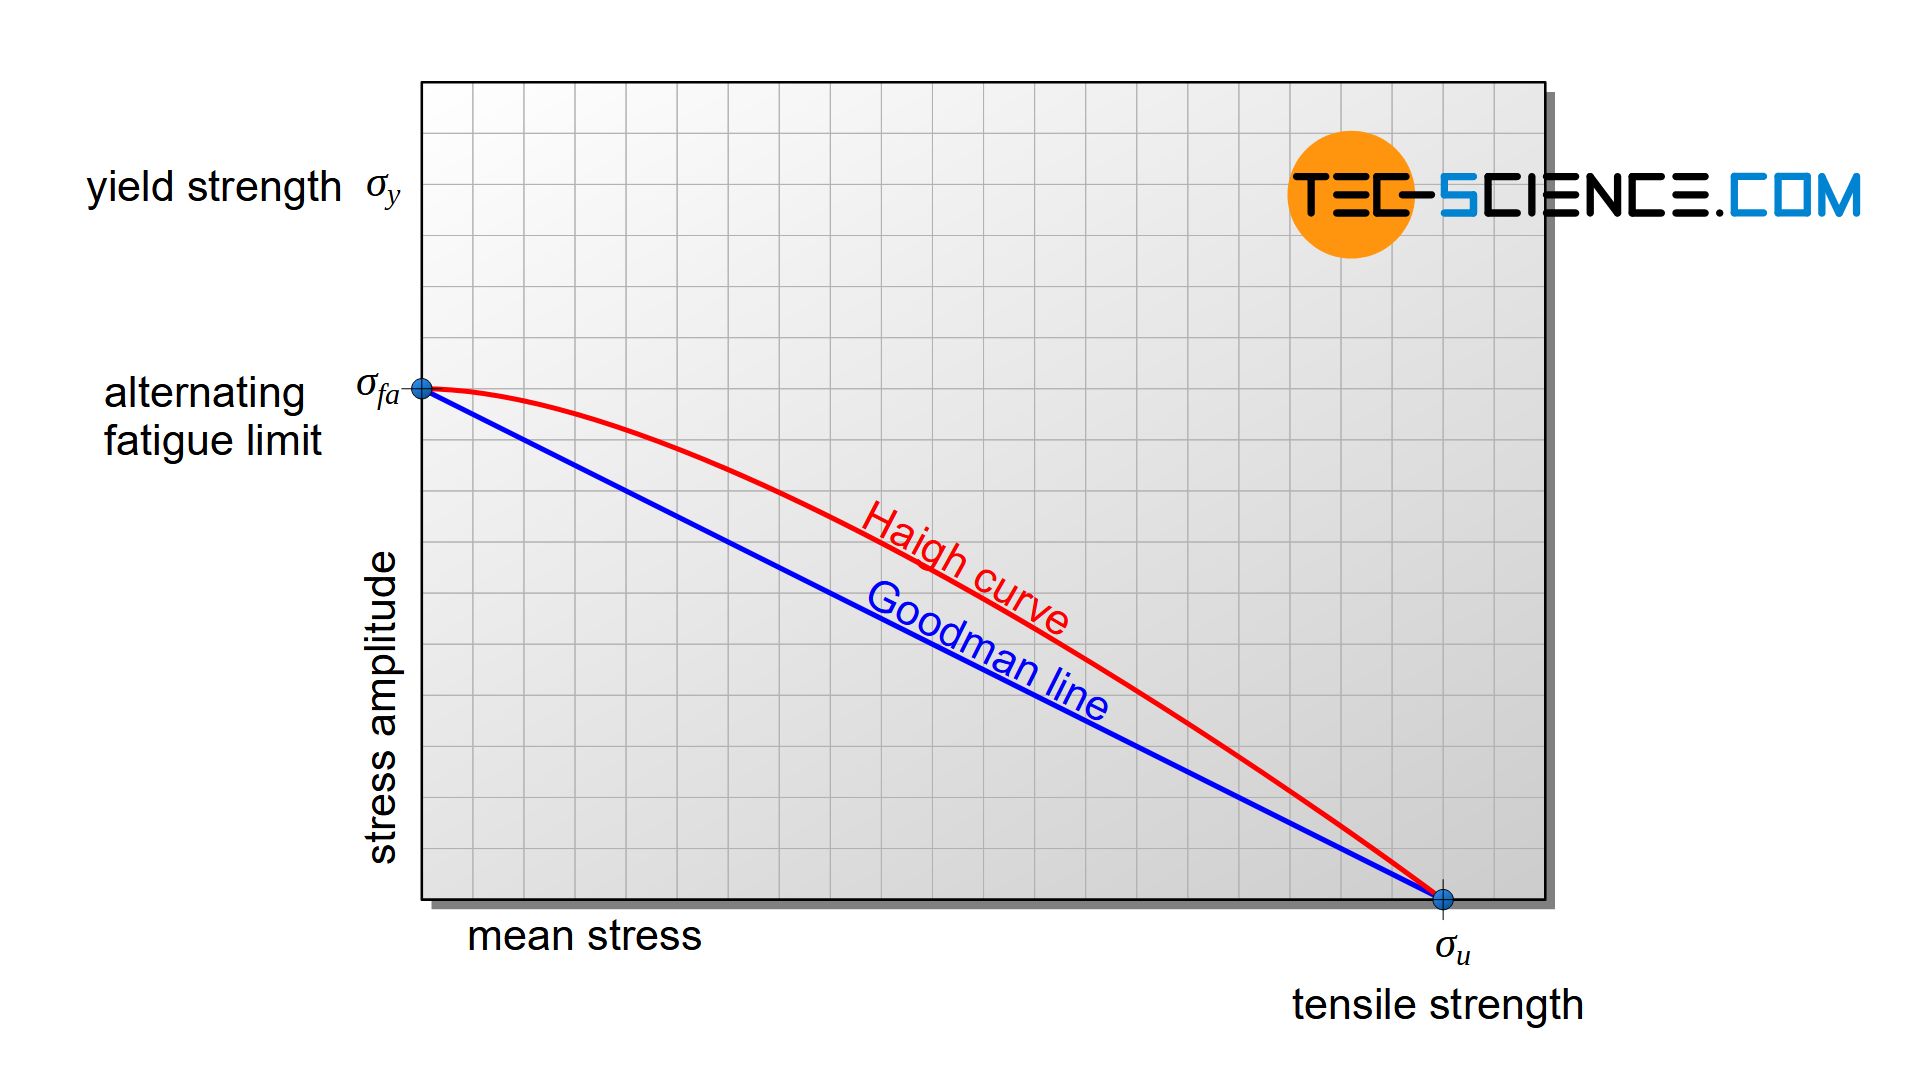
The Haigh curve (“fatigue limit curve”) runs between these aforementioned points. Below the fatigue limit curve are the permissible stress amplitudes for a given mean stress. To simplify the construction of the diagram, the Haigh curve is approached by a straight line, the so-called Goodman line. This approximation results in a kind of “natural safety factor”, as the Goodman line runs below the Haigh curve. The actually bearable stress amplitudes are therefore somewhat larger than the Goodman line suggests.
Especially with high mean stresses, however, the Haigh curve or Goodman line is only of theoretical significance, as the yield point is already exceeded in this range, resulting in unacceptable plastic deformations. The practical limit therefore does not extend up to the tensile strength \(\sigma_u\) but rather only the to yield strength \(\sigma_y\) (or to the offset yield strength).
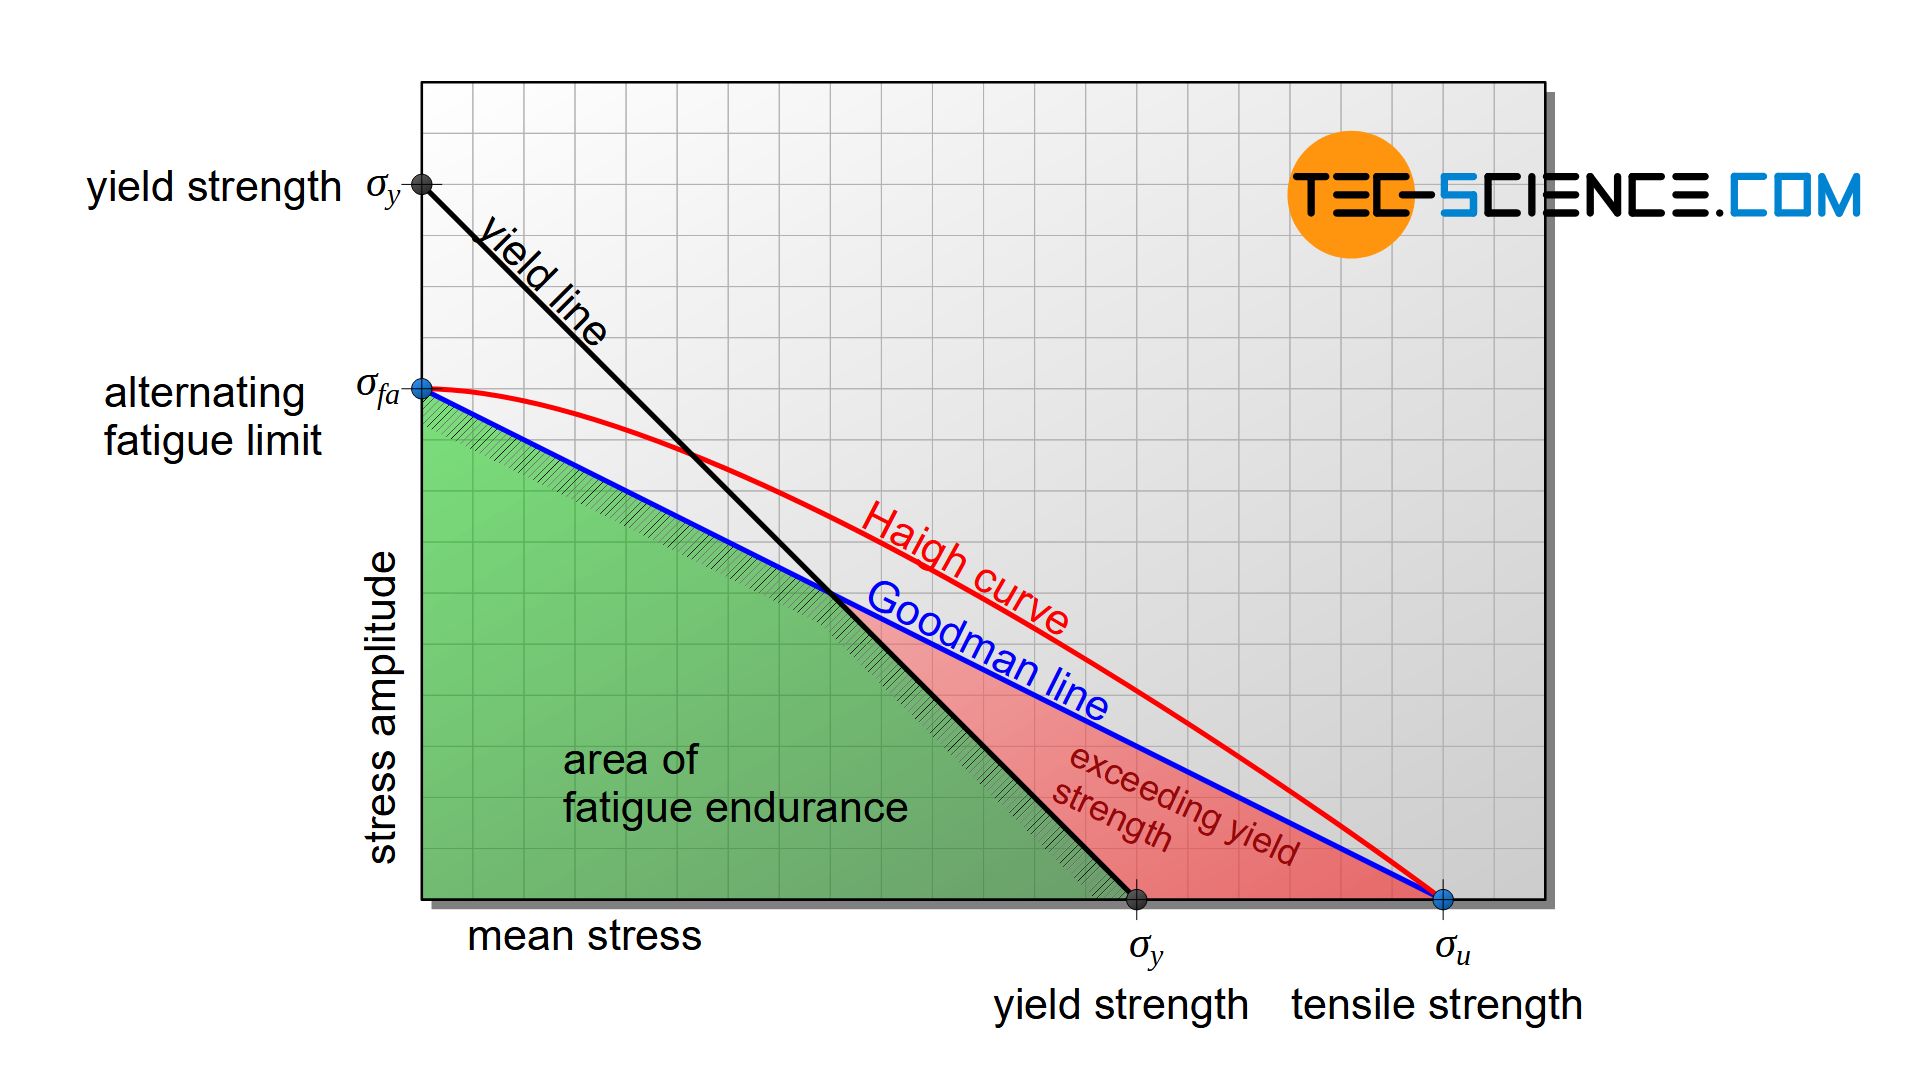
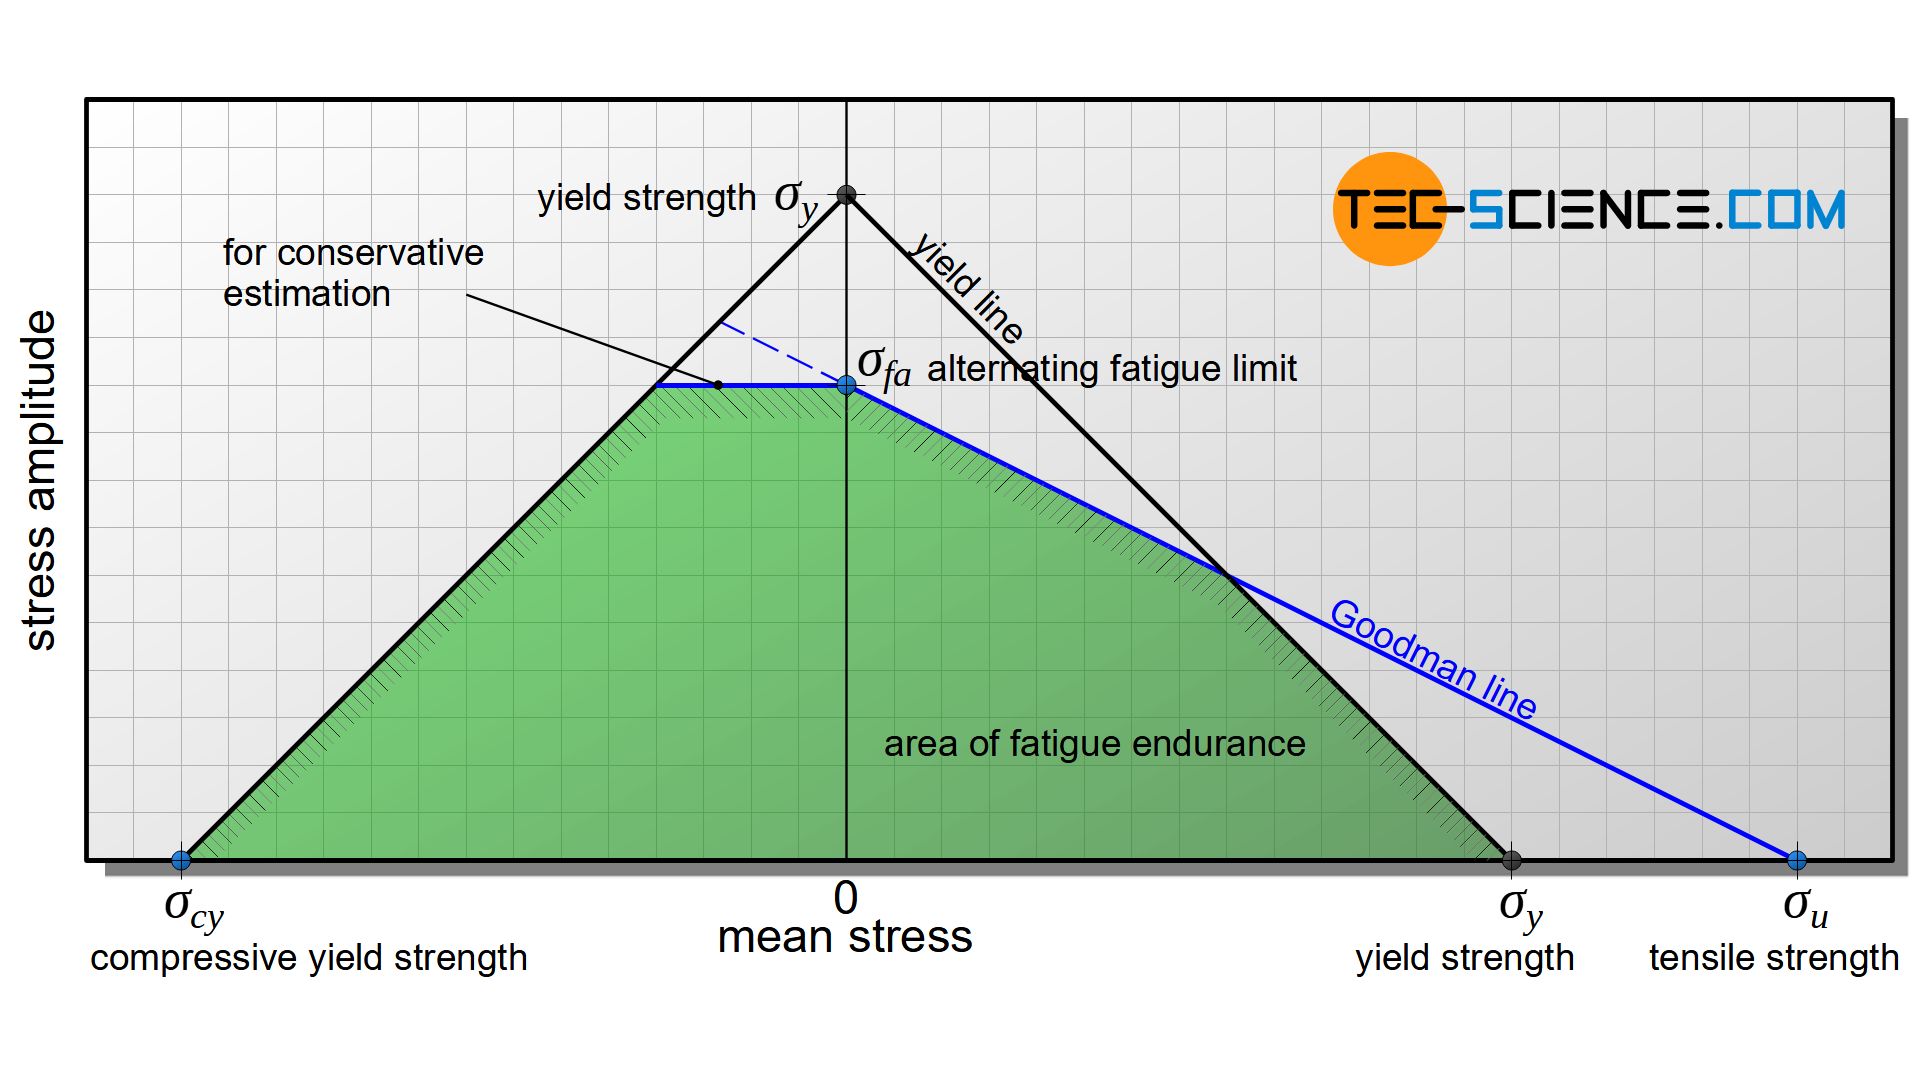
In principle, the sum of mean stress and stress amplitude must never exceed the value of the yield strength. Based on the yield strength value, the stress amplitude can theoretically be increased to the same extent as the mean stress is reduced. For this reason, an additional limitation is a straight line under an angle of 45°, which is also referred to as the yield line.
In this way, two straight lines are obtained in the diagram (Goodman line and yield line), which limit the technically permissible fatigue endurance range. In practice, therefore, only knowledge of the alternating fatigue limit \(\sigma_{fa}\), the tensile strength \(\sigma_u\) and the yield strength \(\sigma_y\) (or the offset yield strength) is sufficient to produce a simplified Haigh diagram.
How to create a Haigh Diagram
The Haigh diagram is obtained by drawing the Goodman line from the point of alternating fatigue limit \(\sigma_{fa}\) on the y-axis to the point of tensile strength \(\sigma_u\) on the x-axis. Then the value of the yield strength is marked on both axes and connected with a straight line (yield line). Goodman and yield line now mark the area of fatigue endurance limit.
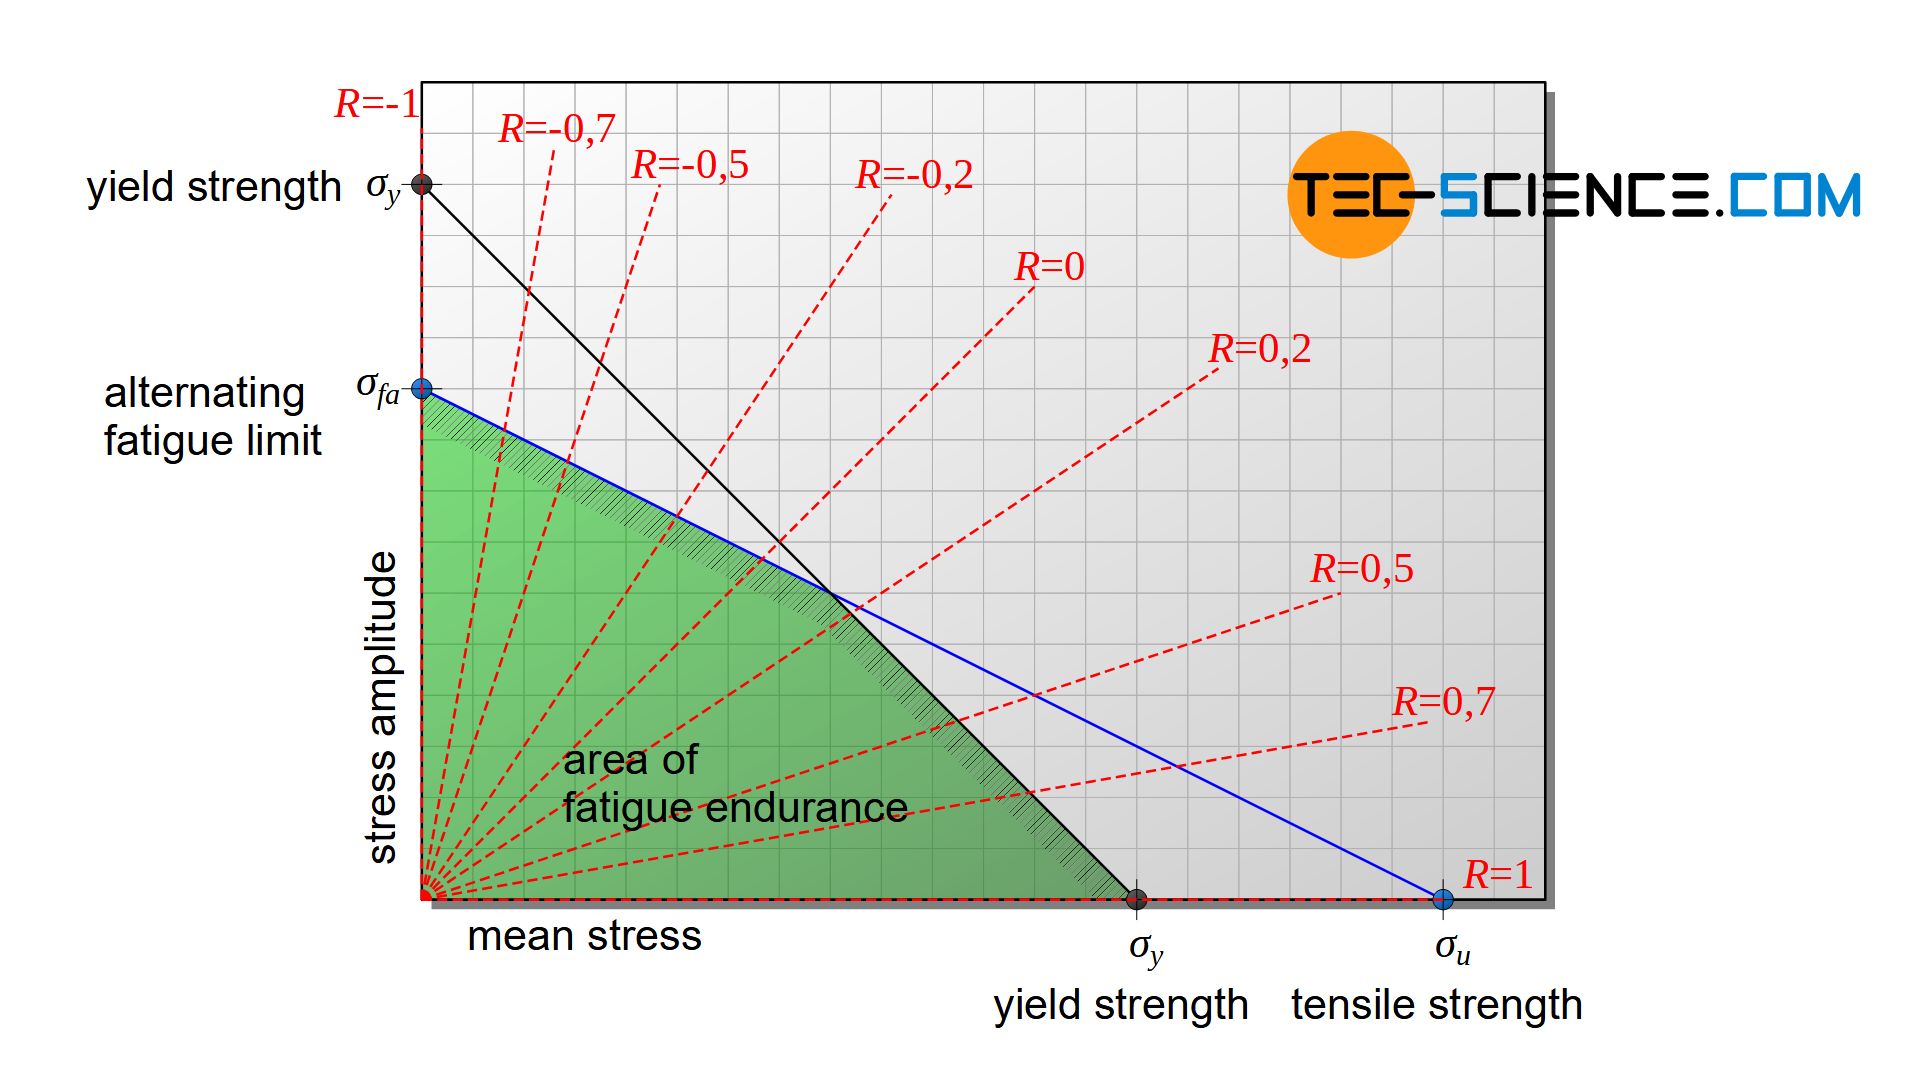
To facilitate reading the fatigue limit for a given stress ratio \(R\), selected stress ratios are often included in the diagram. For each mean stress, the permissible stress amplitude for continuous operation of the material can now be easily read off in the Haigh diagram.
Extension of the Haigh diagram for compressive mean stresses
In principle, the Haigh diagram can also be extended to negative mean stresses and thus the fatigue limits for compressive loads can be shown. The compressive yield strength \(\sigma_{cy}\) is then used as the limiting value for the mean stress. This value is entered on both axes in the same way as for tensile stress and then connected to each other by a straight line. The extrapolation of the Goodman straight limits the area. Whether this extrapolation of the Goodman line is always permissible, however, must be checked separately! For a conservative estimation, this line segment can also be assumed to be horizontal in first approximation.
Note, that due to the effect of “crack closing”, fatigue limits for compressive loadings are in general higher than for tensile loadings. This effect is particularly pronounced in lamellar graphite casting, since the graphite lamellae permit only relatively low tensile stresses due to their notching effect. In contrast, lamellar graphite cast iron absorbs compressive stresses much better.
Smith diagram
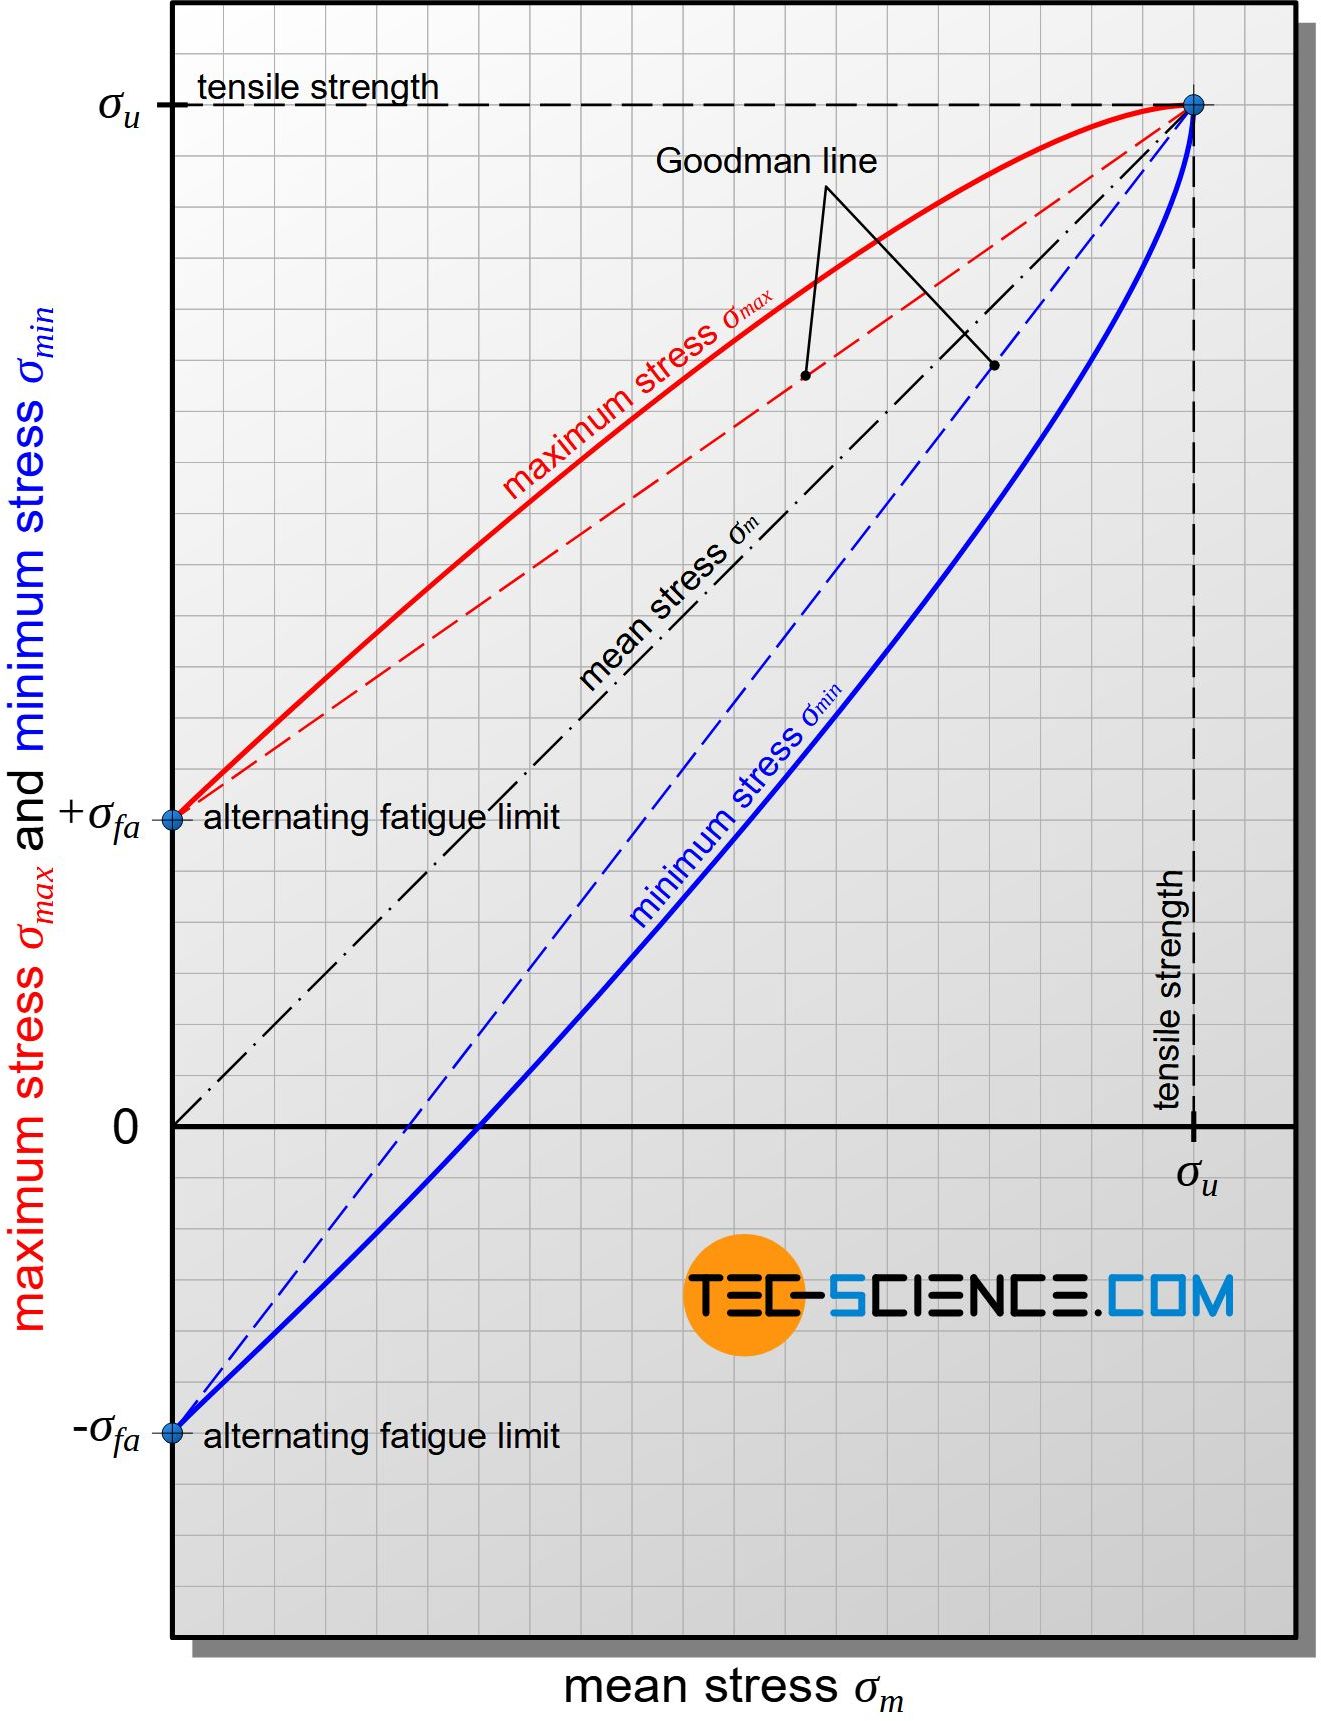
Besides the Haigh diagram, the fatigue limit can also be illustrated in a diagram developed by Smith. In such a Smith diagram, the minimum stress \(\sigma_{min}\) and the maximum stress \(\sigma_{mas}\) are plotted against the mean stress \(\sigma_m\). Based on fundamental considerations, certain fixed points arise again.
How to create a Smith diagram
With a mean stress of \(\sigma_m=0\), the alternating fatigue limit \(\sigma_{fa}\) of the material is obtained, so that the value of the maximum stress is \(+\sigma_{fa}\) and the minimum stress is \(-\sigma_{fa}\). Another fixed point results when the mean stress just reaches the ultimate tensile strength (\(\sigma_m=\sigma_u\)). In this case, the material can no longer withstand stress amplitude, as otherwise the tensile strength would be exceeded. Consequently, the maximum and minimum stresses also correspond to the point of tensile strength. This means that the curves for the maximum and minimum stress must run to this point starting from the points of alternating fatigue limit.
For simplification, the maximum und minimum stress curves can be approximated again as Goodman lines. For practical reasons, there is also an additional limitation, since so far the diagram only takes into account the fracture criterion. Usually, however, inadmissible deformations which occur at stresses above the yield point are decisive. Therefore, the Goodman lines only run up to the maximum value of the yield strength. This applies to both the maximum stress (point A) and the mean stress (point B), since of course the mean stress must not exceed the yield point too.
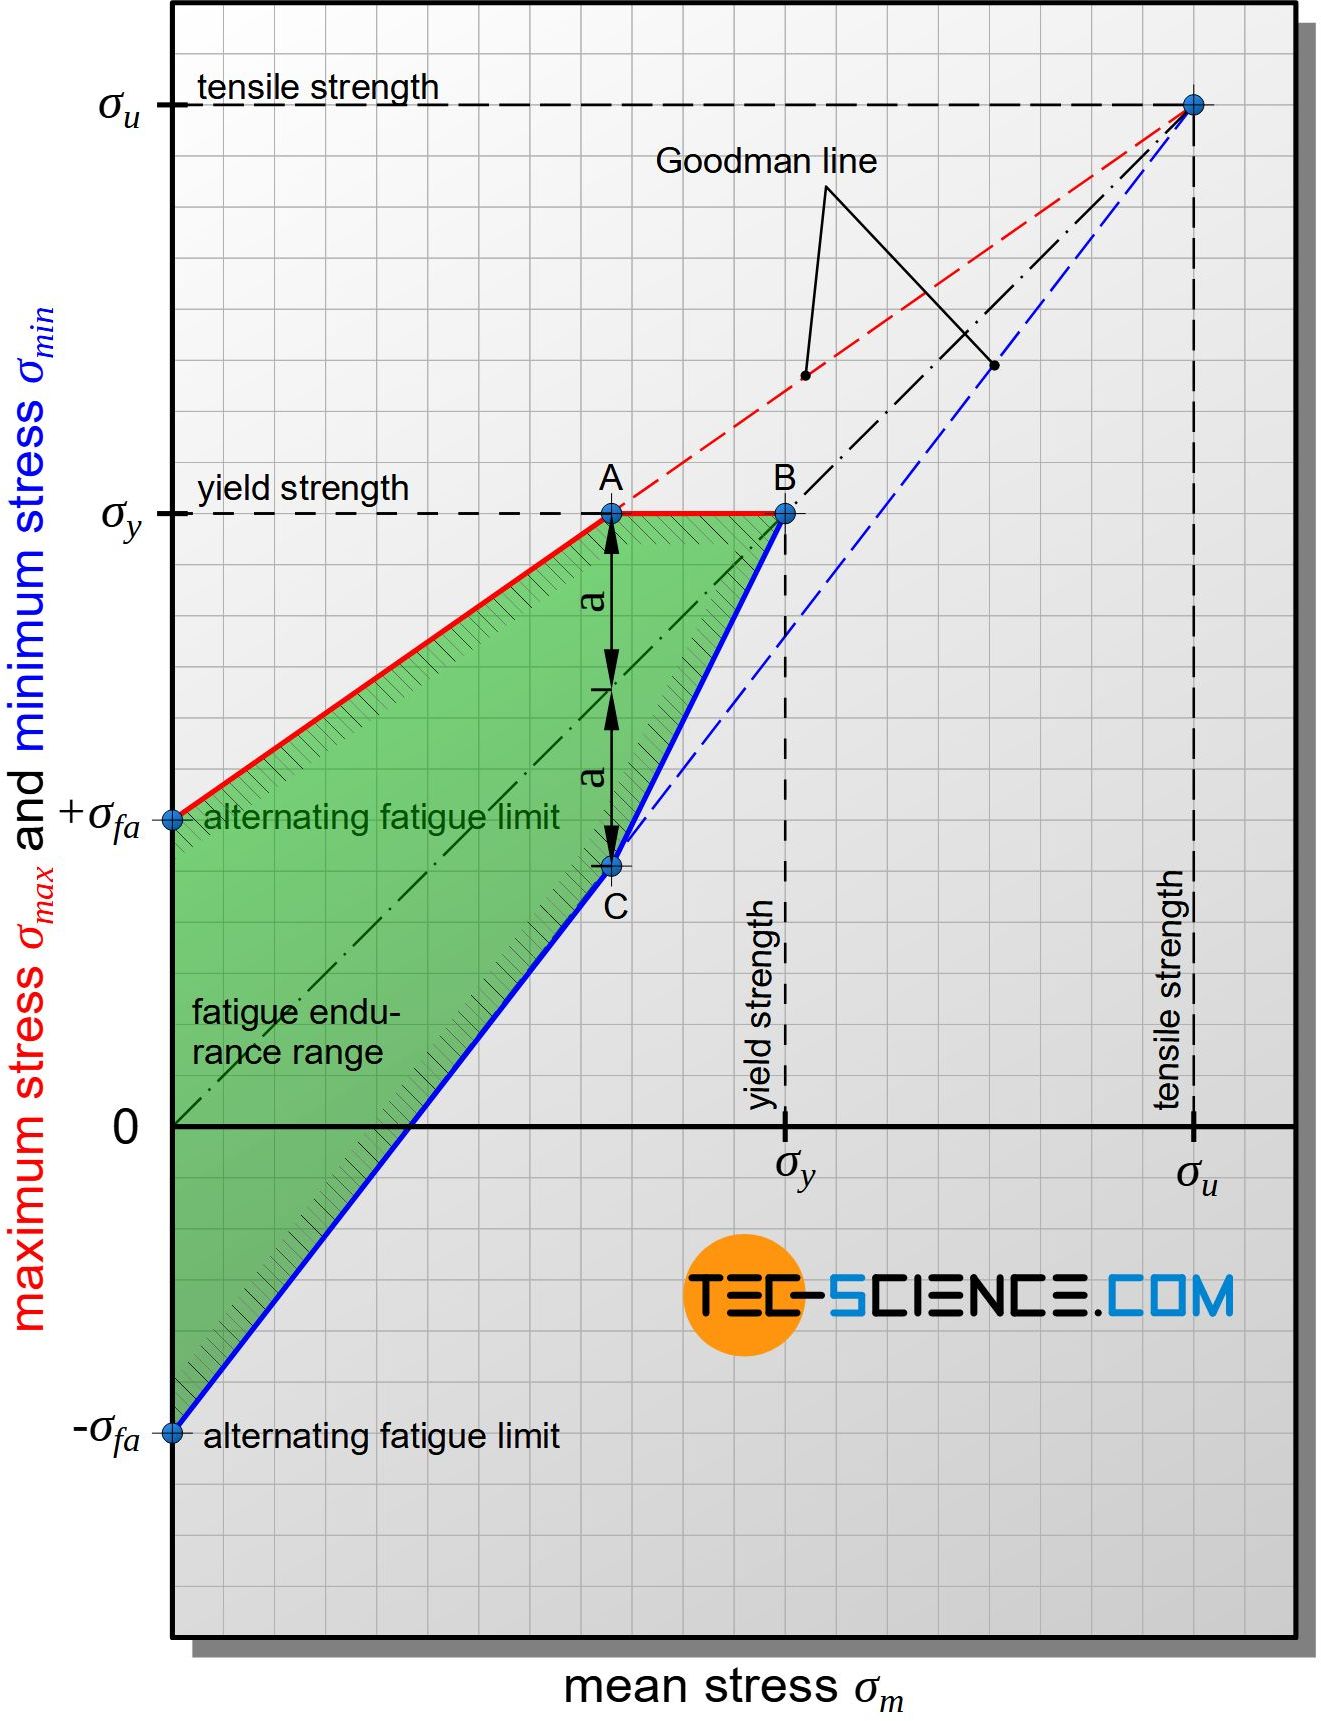
As soon as the yield strength at point A is reached, the line of the maximum stress continues as a horizontal line. However, this leads to a corresponding adjustment of the minimum stress, since the stress amplitudes to the maximum and minimum stress must be symmetrical to the mean stress. To make this adjustment, the distance from point A and the mean stress line is symmetrically shifted downwards and the Goodman line of the minimum stress is reached (point C). The two Goodman lines and the polyline of points A, B, and C now limit the technically relevant fatigue endurance range.
In the Smith diagram, the permissible maximum and minimum stress for a fatigue endurable use of the material can now be read off directly for each mean stress. Using an auxiliary line under 45 degrees, the stress amplitude can also be determined relative easily as the distance to the Goodman line.
Further information on creating the Smith diagram can also be found at construccionenacero.com.
Extension of the Haigh diagram for compressive mean stresses
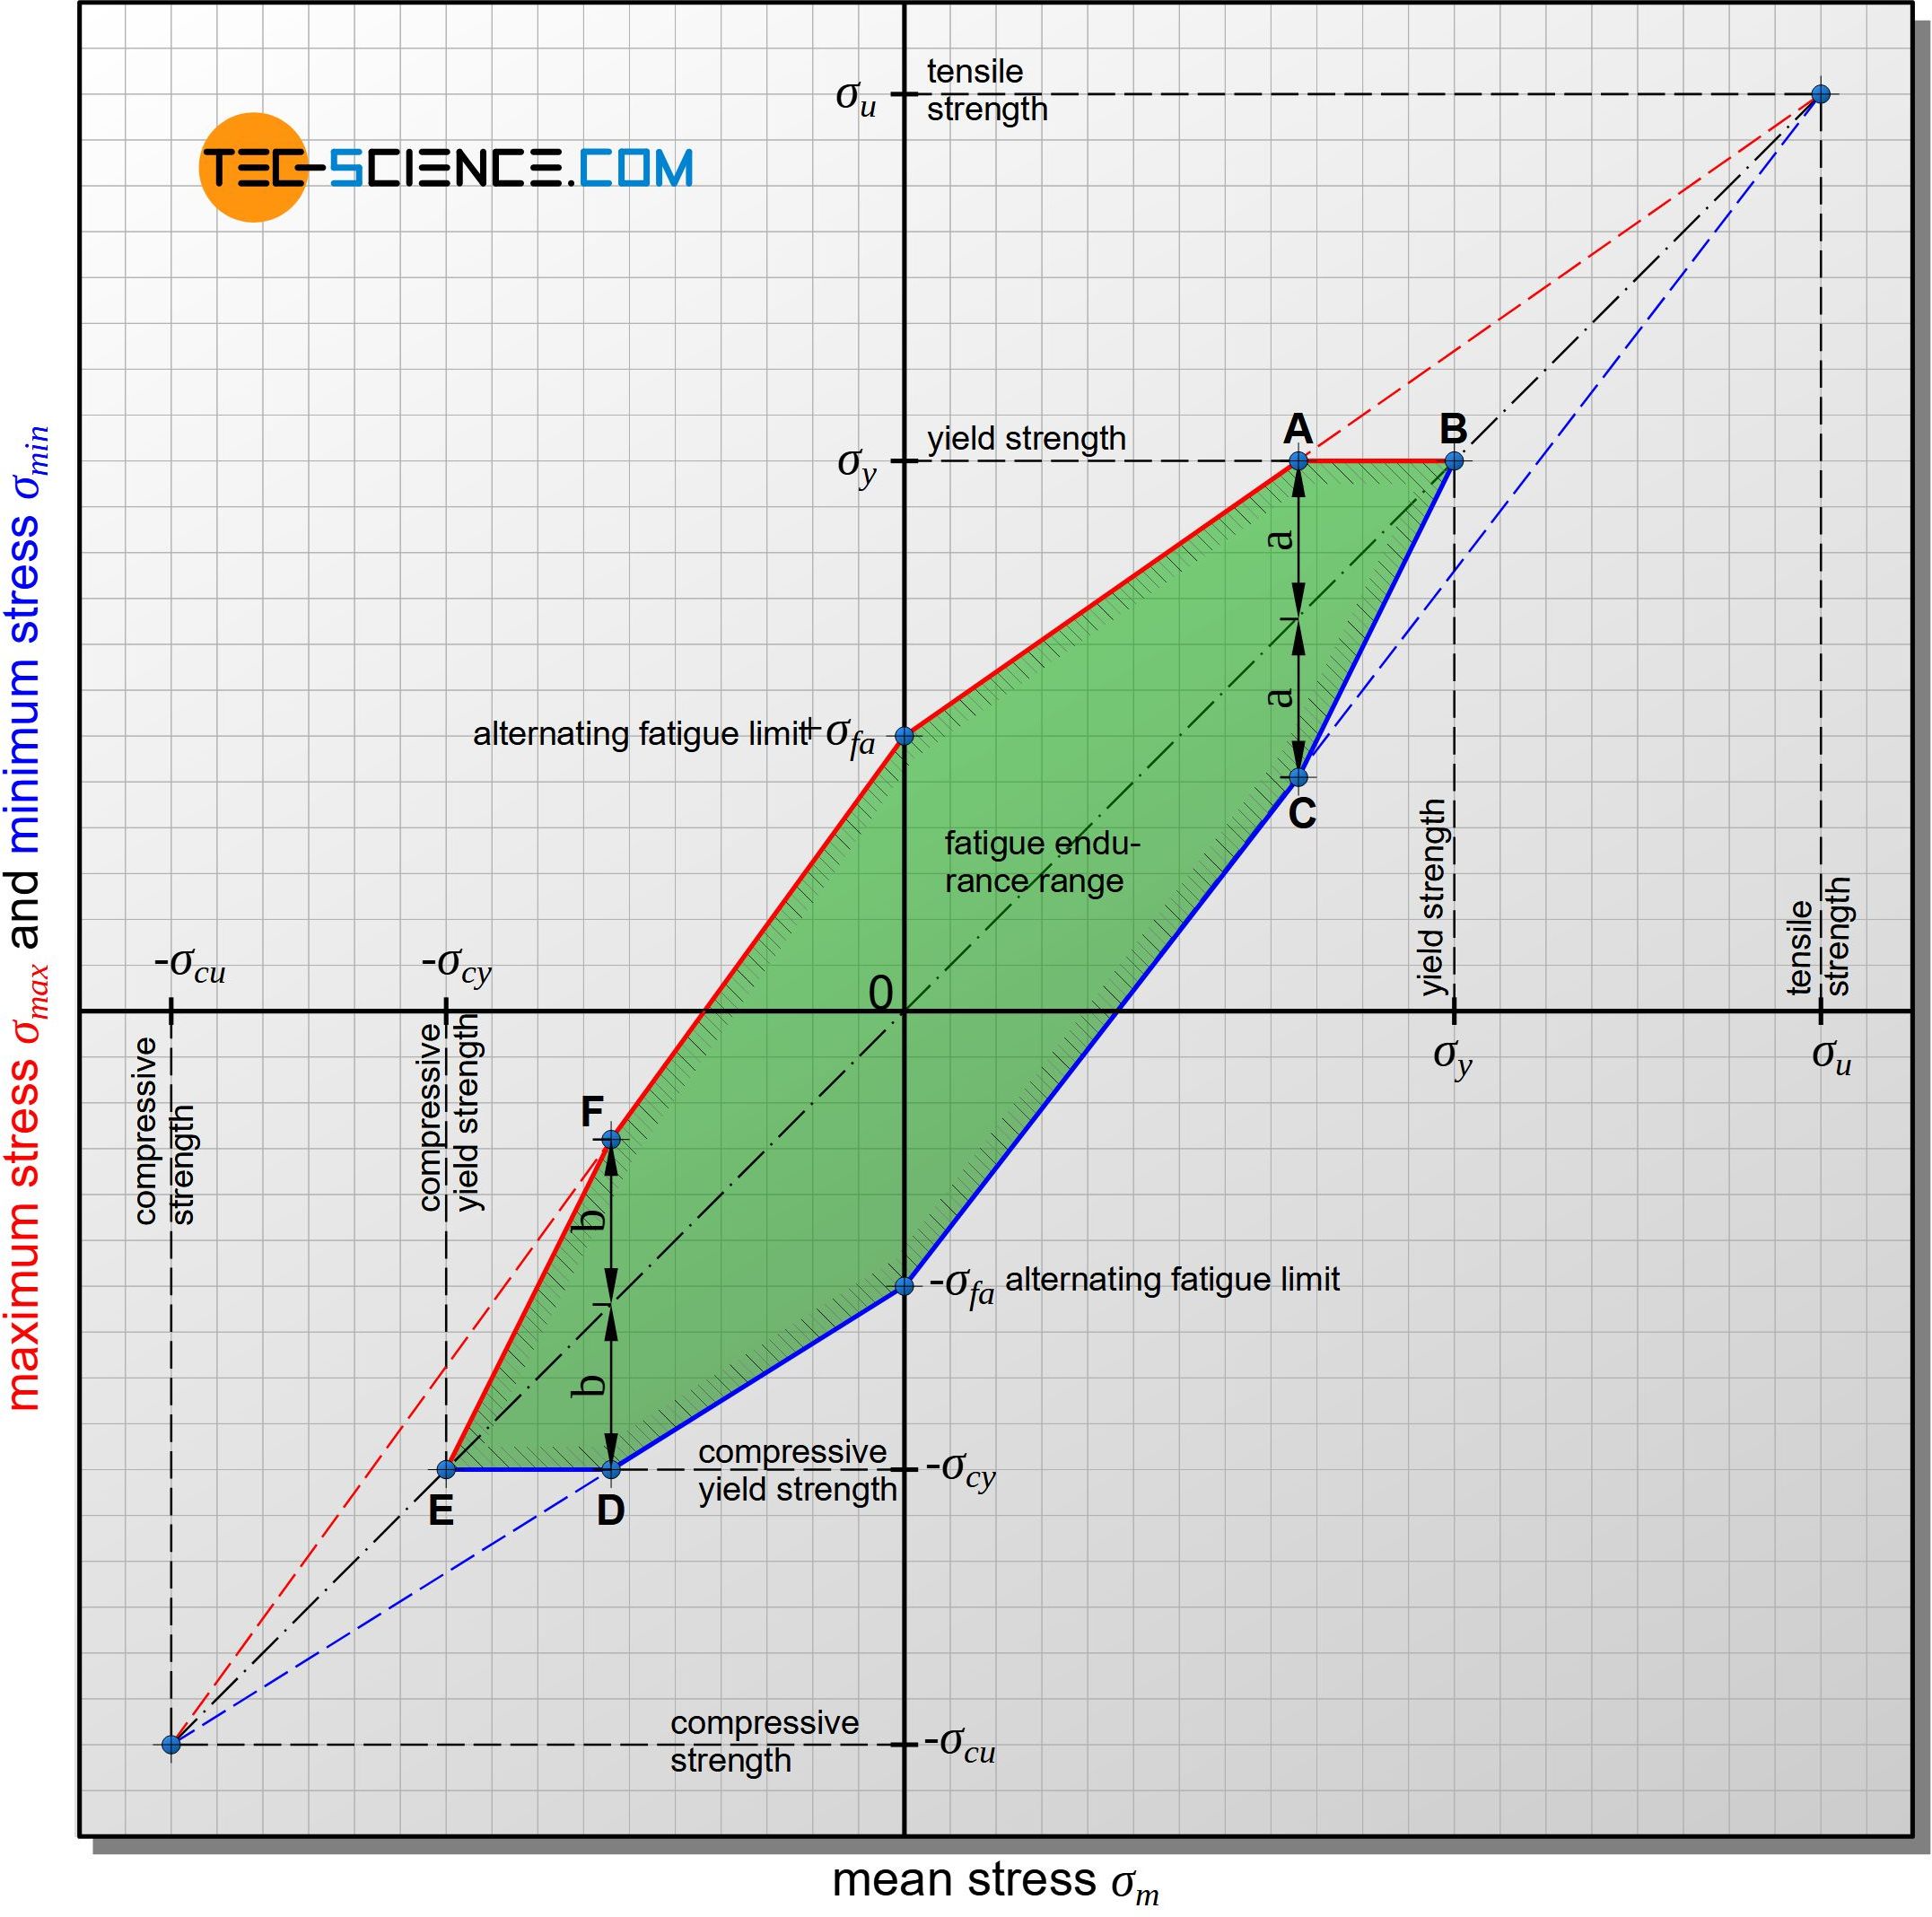
An extension of the Smith diagram to negative mean stress values (compression) is also easily possible. Instead of limiting the maximum stress by the tensile yield strength, the compressive yield strength \(\sigma_{cy}\) is used to limit the minimum stress (point D). The mean stress is also limited by the compressive yield strength (point E). The symmetrical distribution of the minimum and maximum stress values around the mean stress is again obtained by mirroring the point D around the mean stress line (point F).


")
")
")