In this article, learn how the Van der Waals equation can be used to explain the liquefaction of gases at high pressures.
Van der Waals equation
The ideal gas law describes the behavior of ideal gases under simplified conditions. For sufficiently high temperatures and not too high pressures, this equation is also valid in good approximation for real gases. In all other cases, the ideal gas law must be modified and is then called Van der Waals equation. For real gases, this equation takes into account both the volume of the molecules (size of the molecules) and the intermolecular forces between the molecules:
\begin{align}
&\boxed{\left(p+\frac{a}{V_\text{m}^2}\right) \cdot \left(V_\text{m} – b\right) = R_\text{m} \cdot T} ~~~\text{where}~~~\boxed{V_\text{m}=\frac{V}{n}}~~\text{molar volume} \\[5px]
\end{align}
In this equation, “a” denotes the so-called internal pressure due to the mutual attraction of the molecules, while the excluded volume “b” takes into account the size of the gas molecules. Both quantities depend on the type of gas (see table below). The molar volume Vm is the volume occupied by the gas per unite mole (quotient of geometric volume V and amount of substance n). Rm denotes the universal gas constant and T the temperature in the unit Kelvin. More information on the Van der Waals equation and its derivation can be found in the article Van der Waals equation (gas law for real gases).
| Type of gas | Internal pressure a (10-3 J⋅m³/mol²) | Excluded volume b (10-6 m³/mol) |
|---|---|---|
| Ammonia (NH3) | 424 | 37 |
| Argon (Ar) | 136 | 32 |
| Chlorine (Cl2) | 655 | 56 |
| Helium (He) | 3.45 | 24 |
| Carbon dioxide (CO2) | 365 | 43 |
| Air | 136 | 37 |
| Methane (CH4) | 230 | 43 |
| Neon (Ne) | 21 | 17 |
| Propane (C3H8) | 93 | 90 |
| Oxygen (O2) | 138 | 32 |
| Nitrogen (N2) | 141 | 39 |
| Water (H2O) | 553 | 30 |
| Hydrogen(H2) | 25 | 27 |
Liquefaction of gases at high pressures
The Van der Waals equations can be used not only to describe the behavior of real substances in the gas phase, but also to explain the phase transition from the gaseous state to the liquid state at high pressures. To show this, the Van der Waals equation is first rearranged so that the pressure p can be represented as a function of the volume Vm:
\begin{align}
&\boxed{p(V_\text{m}) = \frac{R_\text{m} \cdot T}{V_\text{m} – b} – \frac{a}{V_\text{m}^2} } \\[5px]
\end{align}
Using carbon dioxide as an example, the volume-pressure diagram below shows the pressure as a function of volume at a temperature of 283 K. In principle, this diagram shows the isothermal compression of gaseous carbon dioxide. For this purpose, one can imagine one mole of carbon molecules that initially occupy a volume of 800 cm³ (state 1). In this state, the pressure is around 25 bar. If the volume is now isothermally reduced, the pressure increases as expected. With a volume of 175 cm², the pressure has increased to almost 60 bar (state 2).
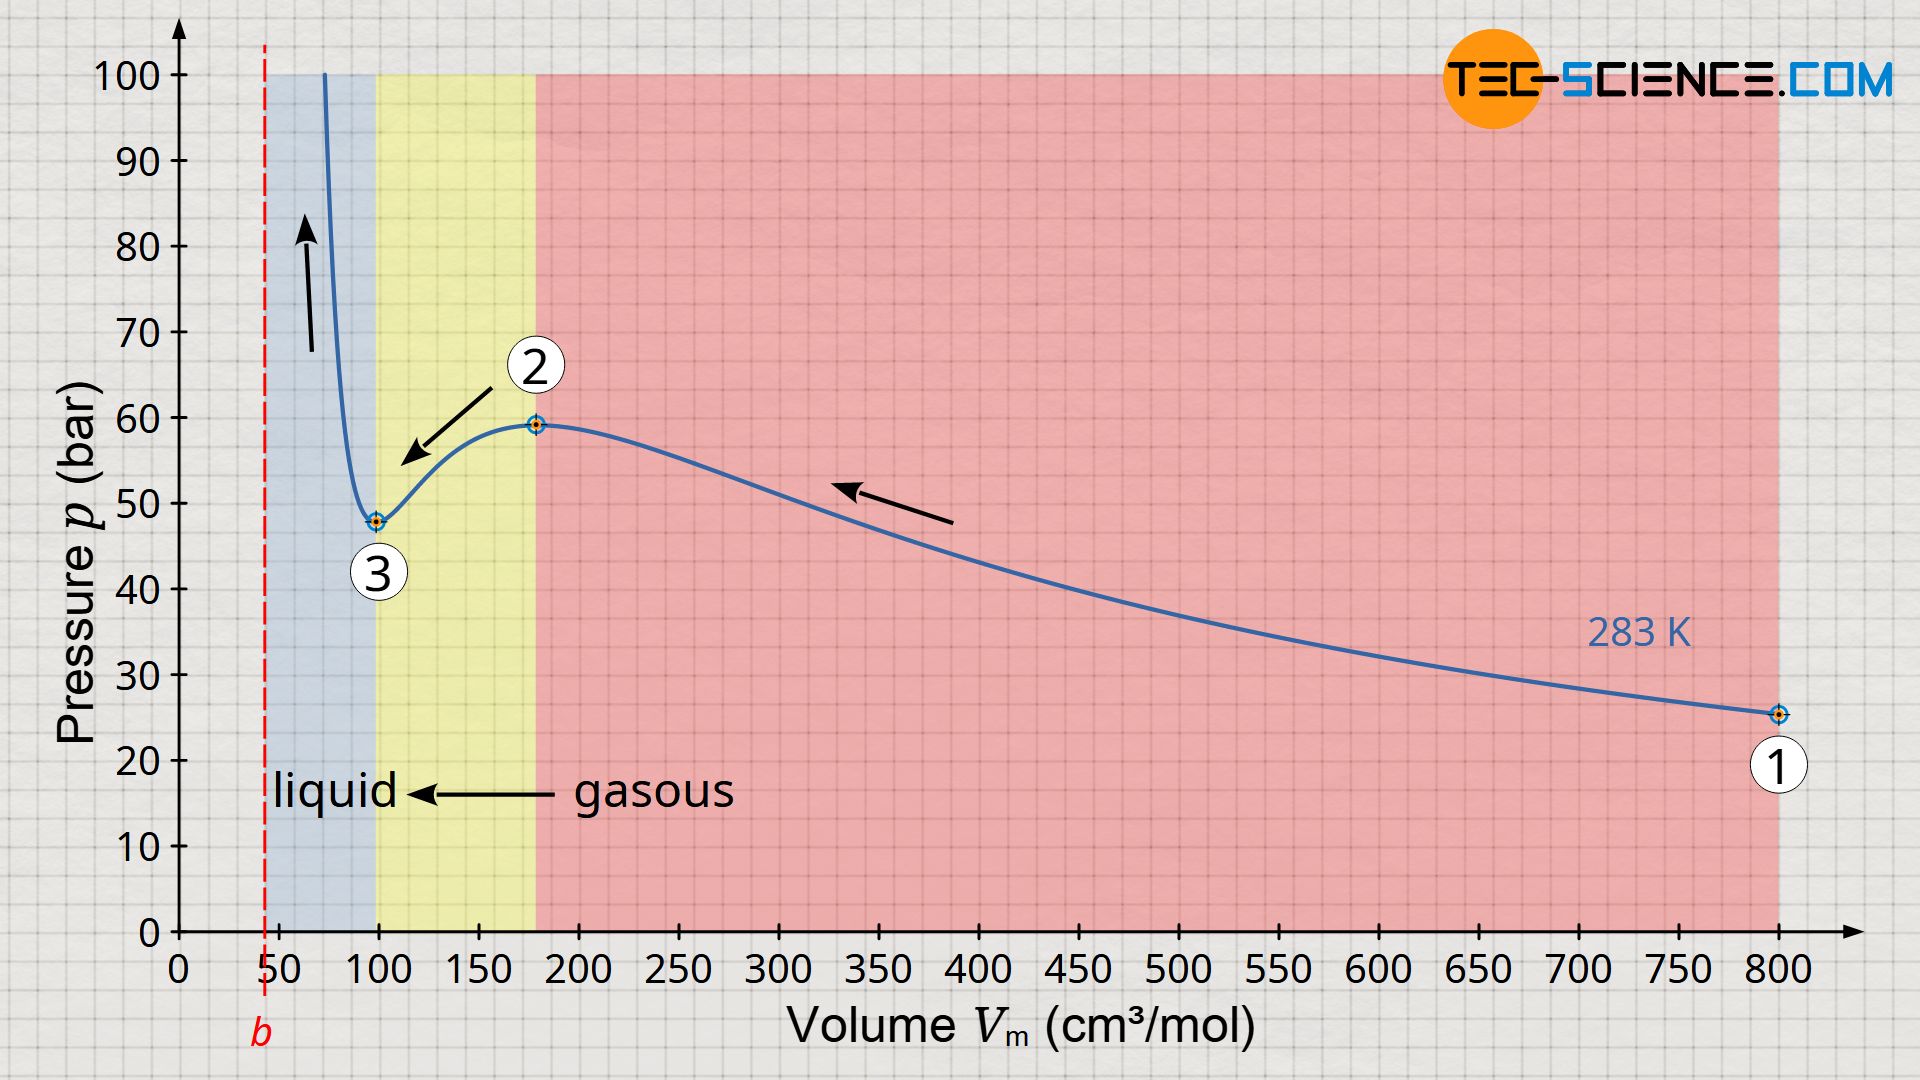
With further volume reduction, however, something paradoxical now happens (change of state from 2 to 3). According to the curve shown, the pressure decreases with further compression. However, experience shows that compression cannot suddenly result in a reduction in pressure. In this region from state 2 to 3, the Van der Waals equation obviously no longer reflects the correct behavior of the carbon dioxide! But below a volume of about 100 cm³, a further compression is associated with a pressure increase again, as expected. In this case, however, the pressure rises extremely sharply, as is actually only known from liquids, which are almost incompressible. And in fact, this is the liquid phase of the carbon dioxide, which has liquefied due to the high pressure.
Such liquefaction at high pressures is often used when filling gases into gas cylinders. The minimum volume of the liquefied gas is limited by the volume (size) of the molecules, which is determined by the excluded volume “b” according to the Van der Waals equation. As the volume approaches the excluded volume “b”, the pressure thus increases to infinity.
Looking at the function in the volume-pressure diagram above, one might think that liquefaction takes place between the maximum (2) and minimum (3). However, practice shows that isothermal liquefaction takes place at constant pressure, the so-called saturation vapor pressure. So the question arises, how this horizontal line of liquefaction must run in the diagram? At this point, we refer to the article Concept of pressure-volume work, in which it was explained in detail that the area under the curve in a volume-pressure diagram has the dimension of an energy.
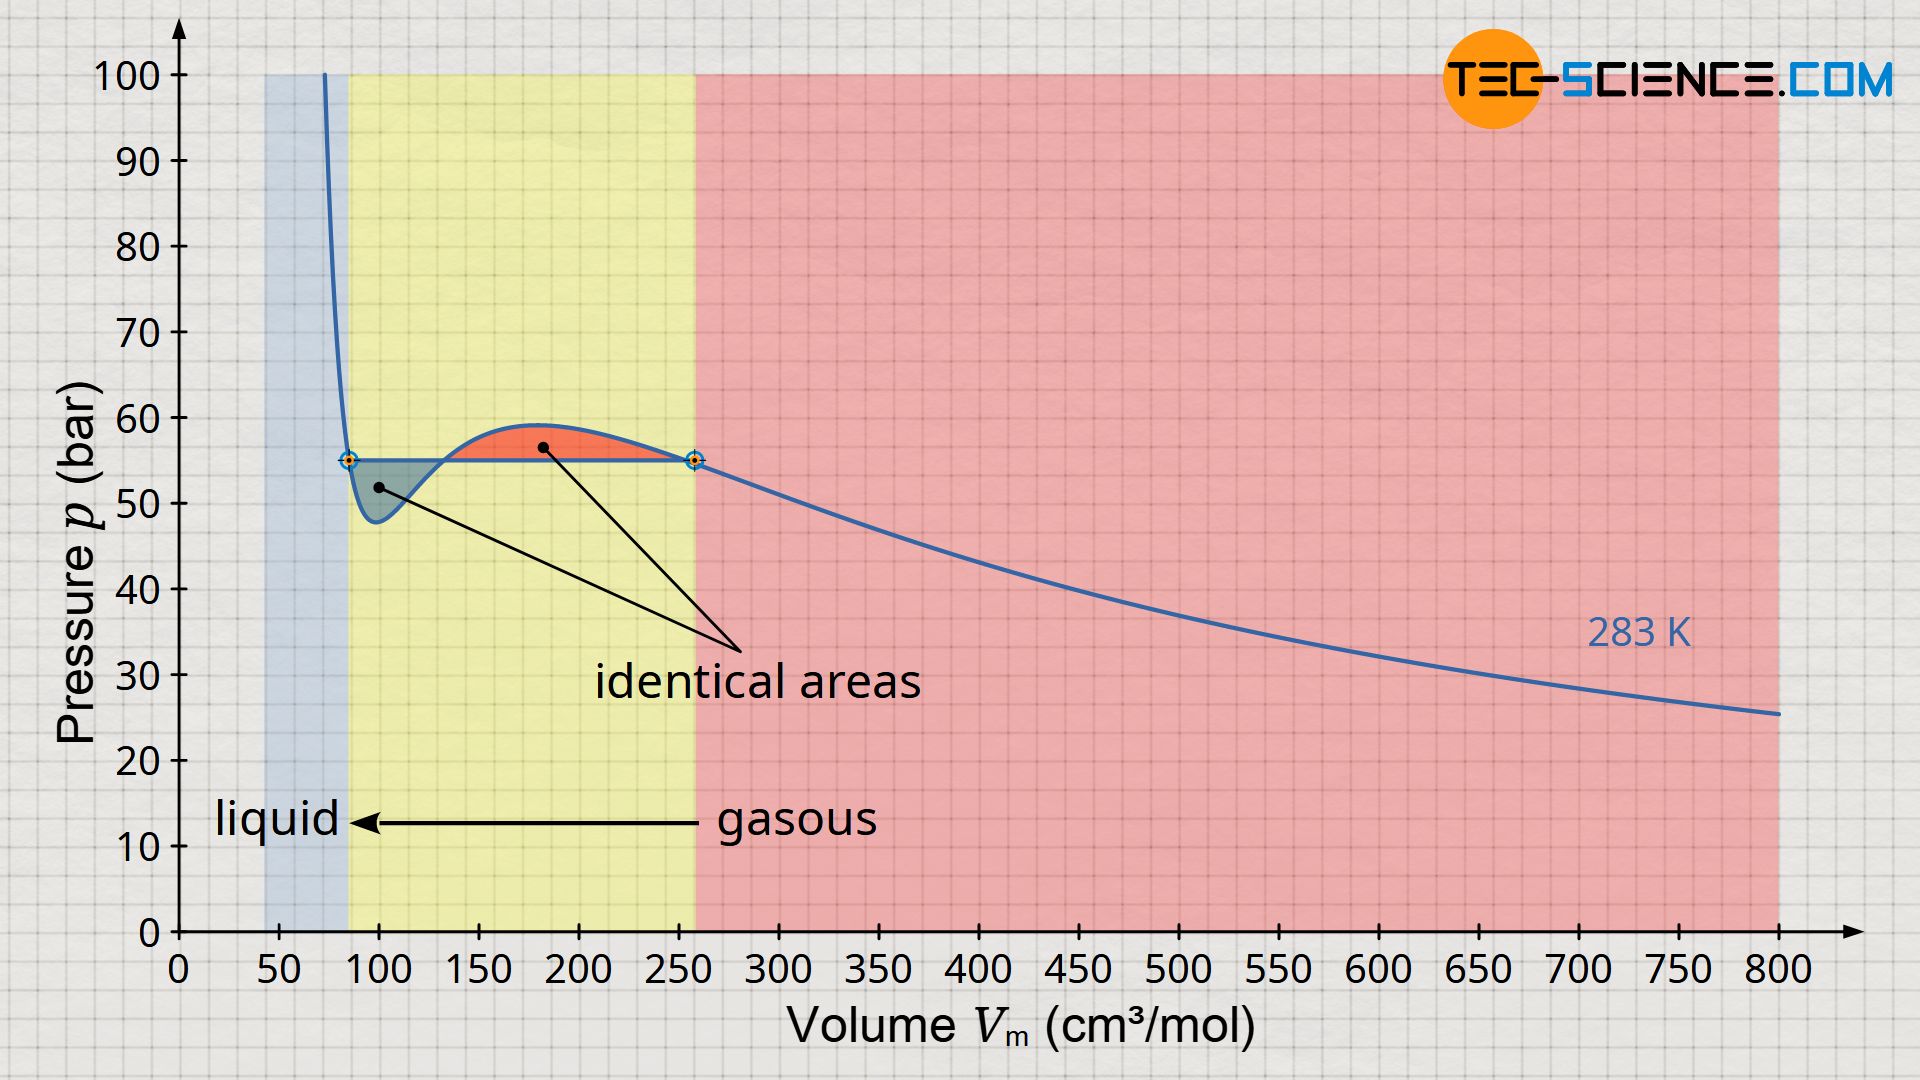
Thus, in order not to violate the law of conservation of energy, the horizontal line describing the liquefaction must consequently run in such a way that the areas forming in the diagram below and above the horizontal line are of equal size (so-called “Maxwell equal area rule” or “Maxwell construction“). The curve which results purely mathematically from the Van der Waals equation and which “snakes” around the horizontal line is also called “Van der Waals isotherm oscillation”. The horizontal line itself corresponds to the saturation vapor pressure.
The areas between Maxwell straight line (saturation vapor pressure) and Van der Waals isotherm oscillation must be equal (Maxwell equal area rule)!
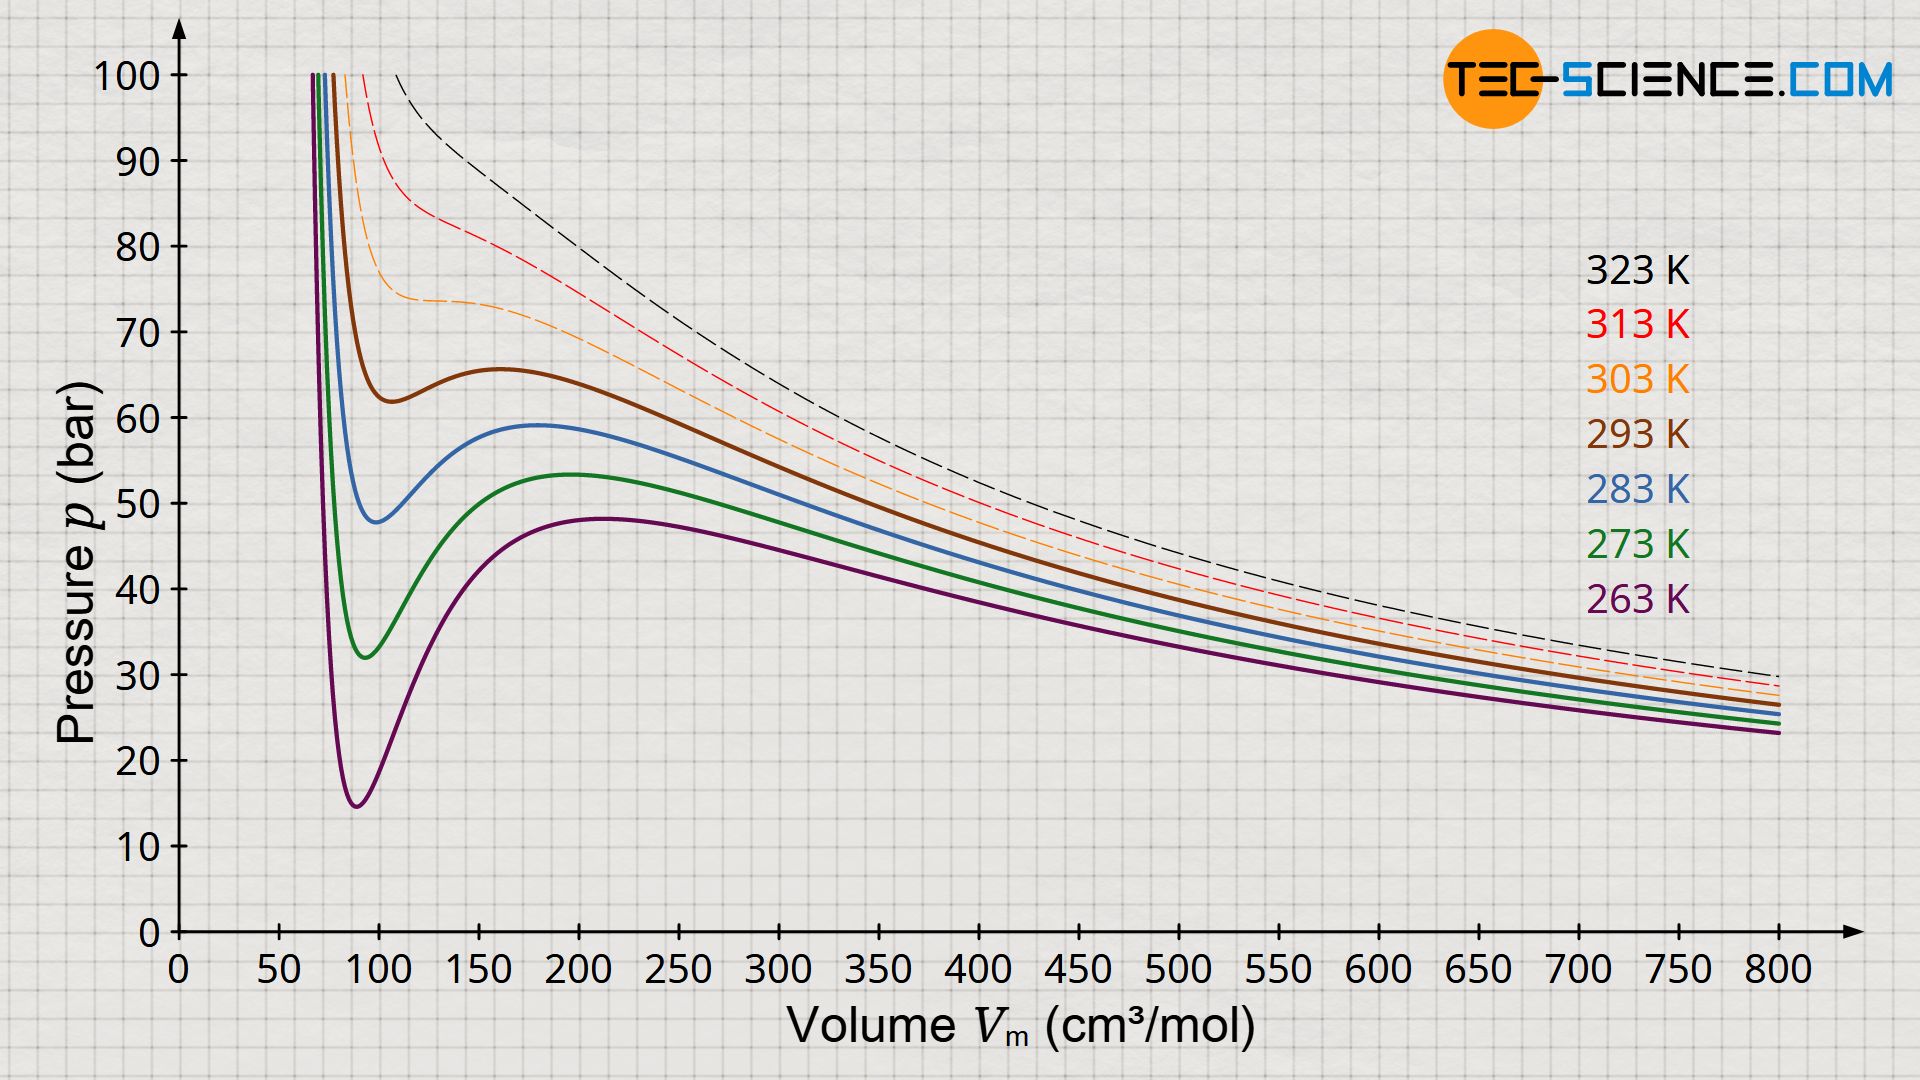
The figure above shows the pressure function according to the Van der Waals equation for different isotherms. According to Maxwell construction, this results in a characteristic phase diagram which describes the transition from the gaseous to the liquid state for selected temperatures (diagram below). It can be seen that above a certain temperature the Van der Waals equation no longer shows an isothermal oscillation with a maximum and minimum, but in this limiting case only a horizontal inflection point. This point is also called the critical point. Changes of state above this critical point take place without a classical phase transition!
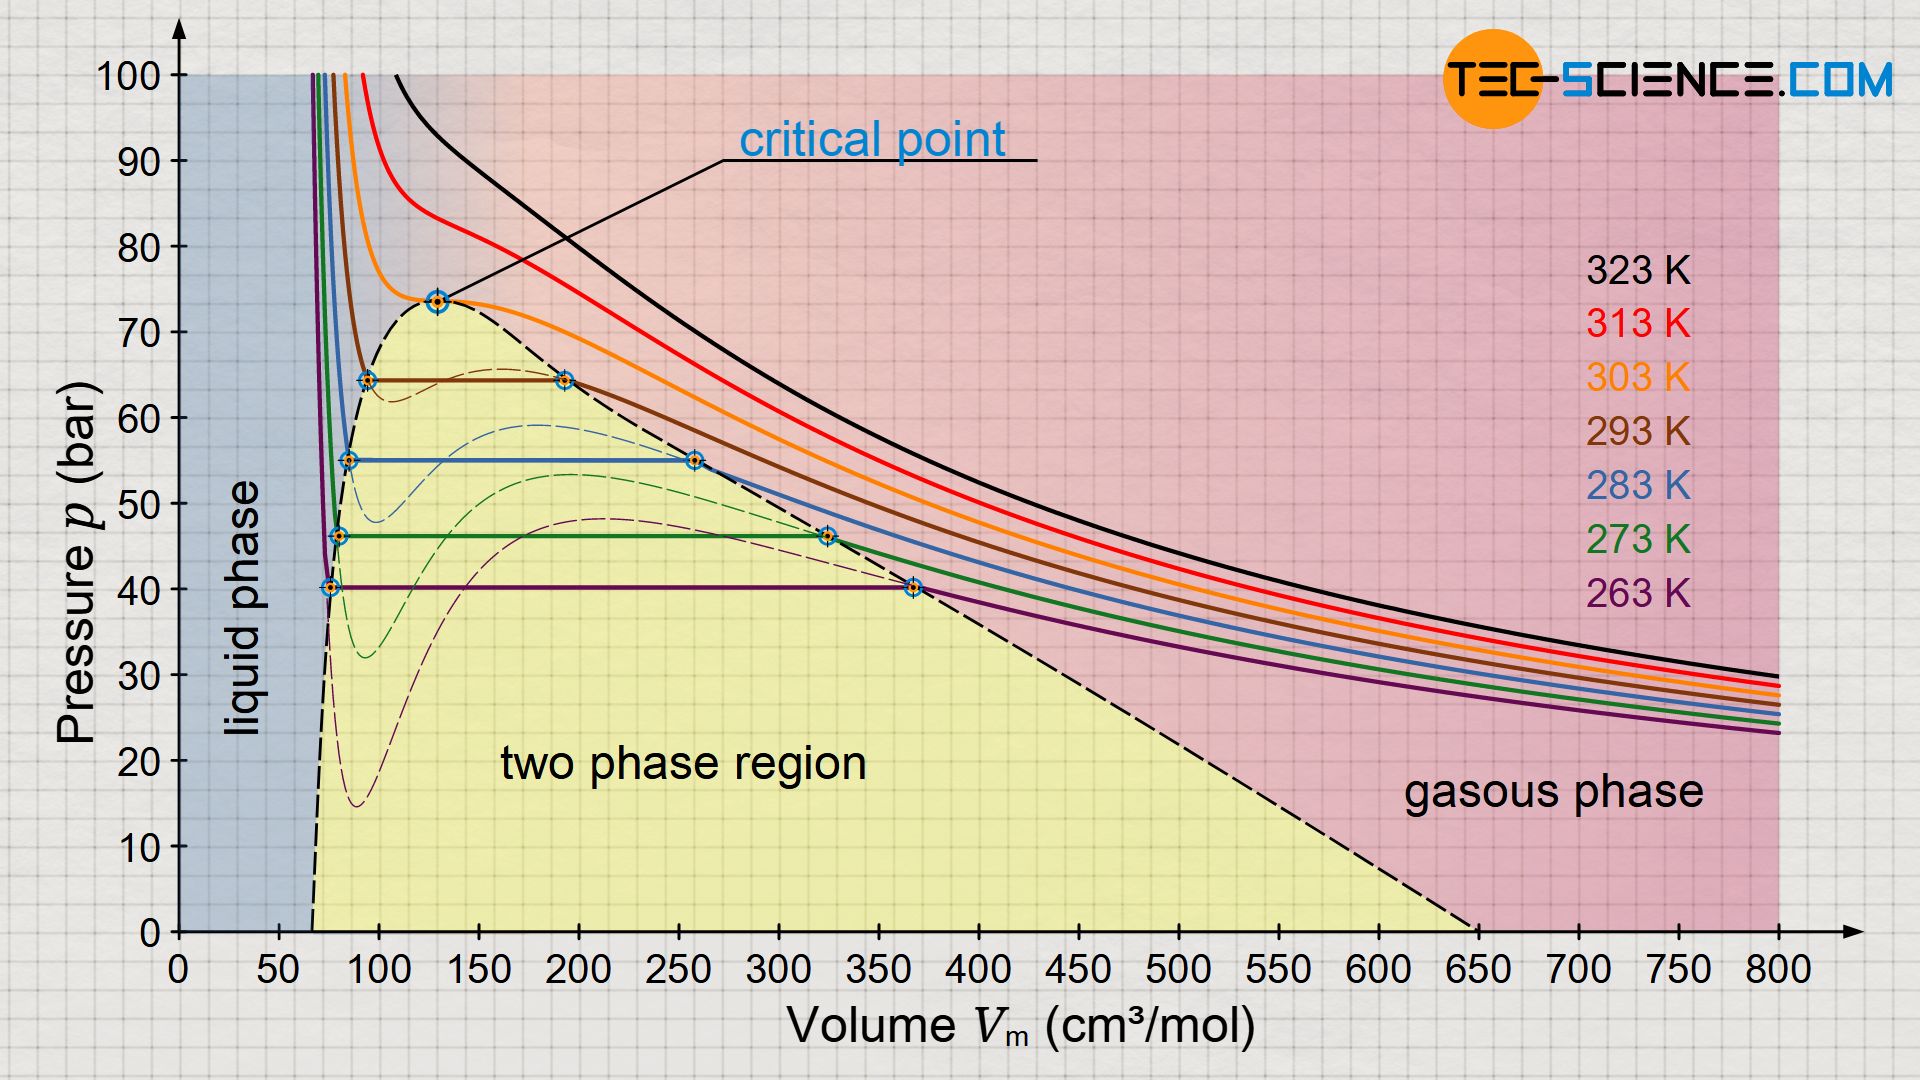
In such supercritical processes, there is no longer any visible phase transition. While classical phase transitions are characterized by abrupt changes in physical properties such as volume, density, heat capacity, thermal conductivity, etc., supercritical states lack such features. Consequently, it is no longer possible to distinguish between liquid and gaseous states. It is a continuous transition of properties without being able to assign a typical state of matter to the substance.
Supercritical thermodynamic processes are technically used, for example, in modern steam-electric power stations, with which efficiencies of over 50 % can be realized.
")


