The law of Amontons describes the relationship between an increase in temperature and the resulting increase in pressure at constant volume (isochoric process).
Isochoric process
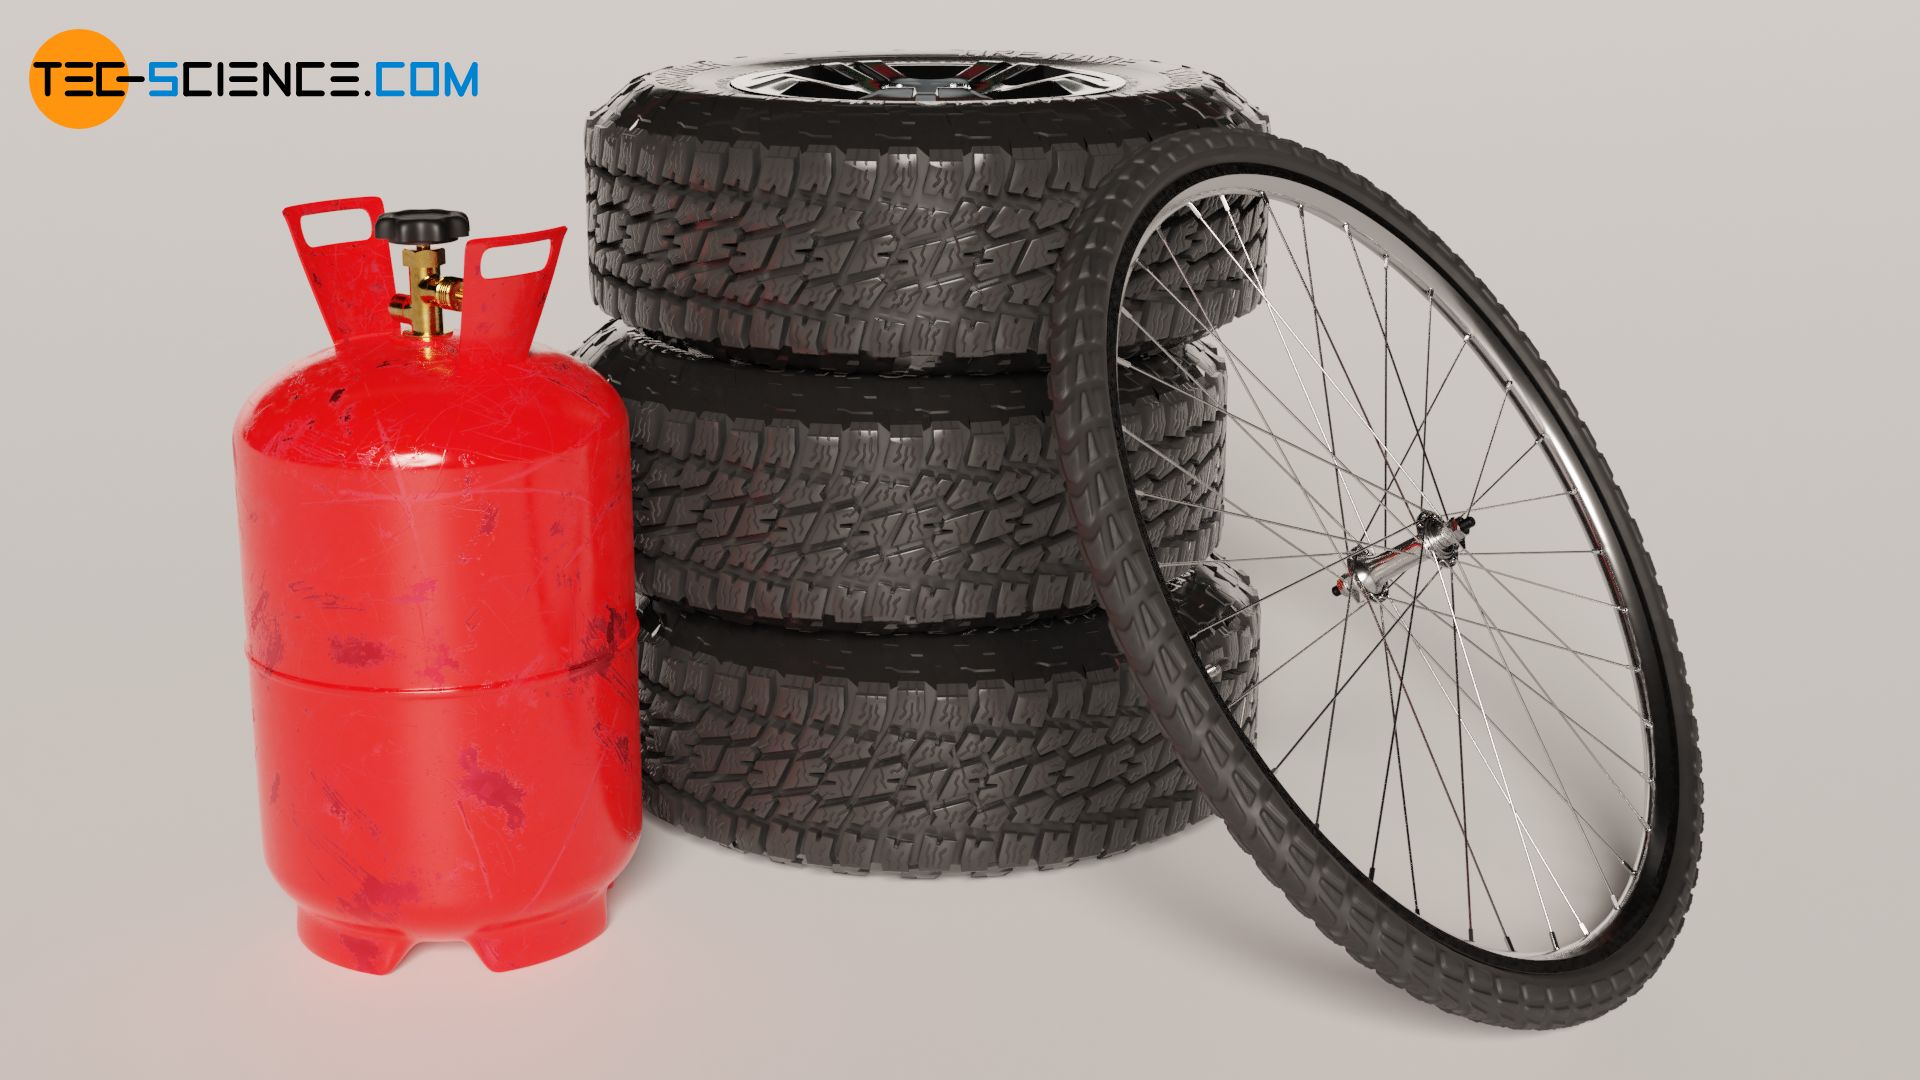
If a thermodynamic process takes place at constant volume, it is called an isochoric process. For example, such an isochoric change of state of a gas is present in tires or gas cylinders that are heated by the sun in summer. The volume of the gas is only determined by the dimensions of the tire or cylinder, which (almost) does not change during the heating. Everyday experience shows that the pressure increases with such an isochoric increase in temperature. The exact mathematical relationship between gas pressure and gas temperature for an isothermal process in a closed system is explained in more detail in this article.
Experimental investigation
A glass vessel is used to investigate the relationship, which is sealed with a cork. The enclosed gas volume remains constant. The gas used is air, which can be considered an ideal gas. A pressure gauge is used to determine the gas pressure (absolute pressure). A thermometer, which measures the gas temperature, is also connected to the vessel.
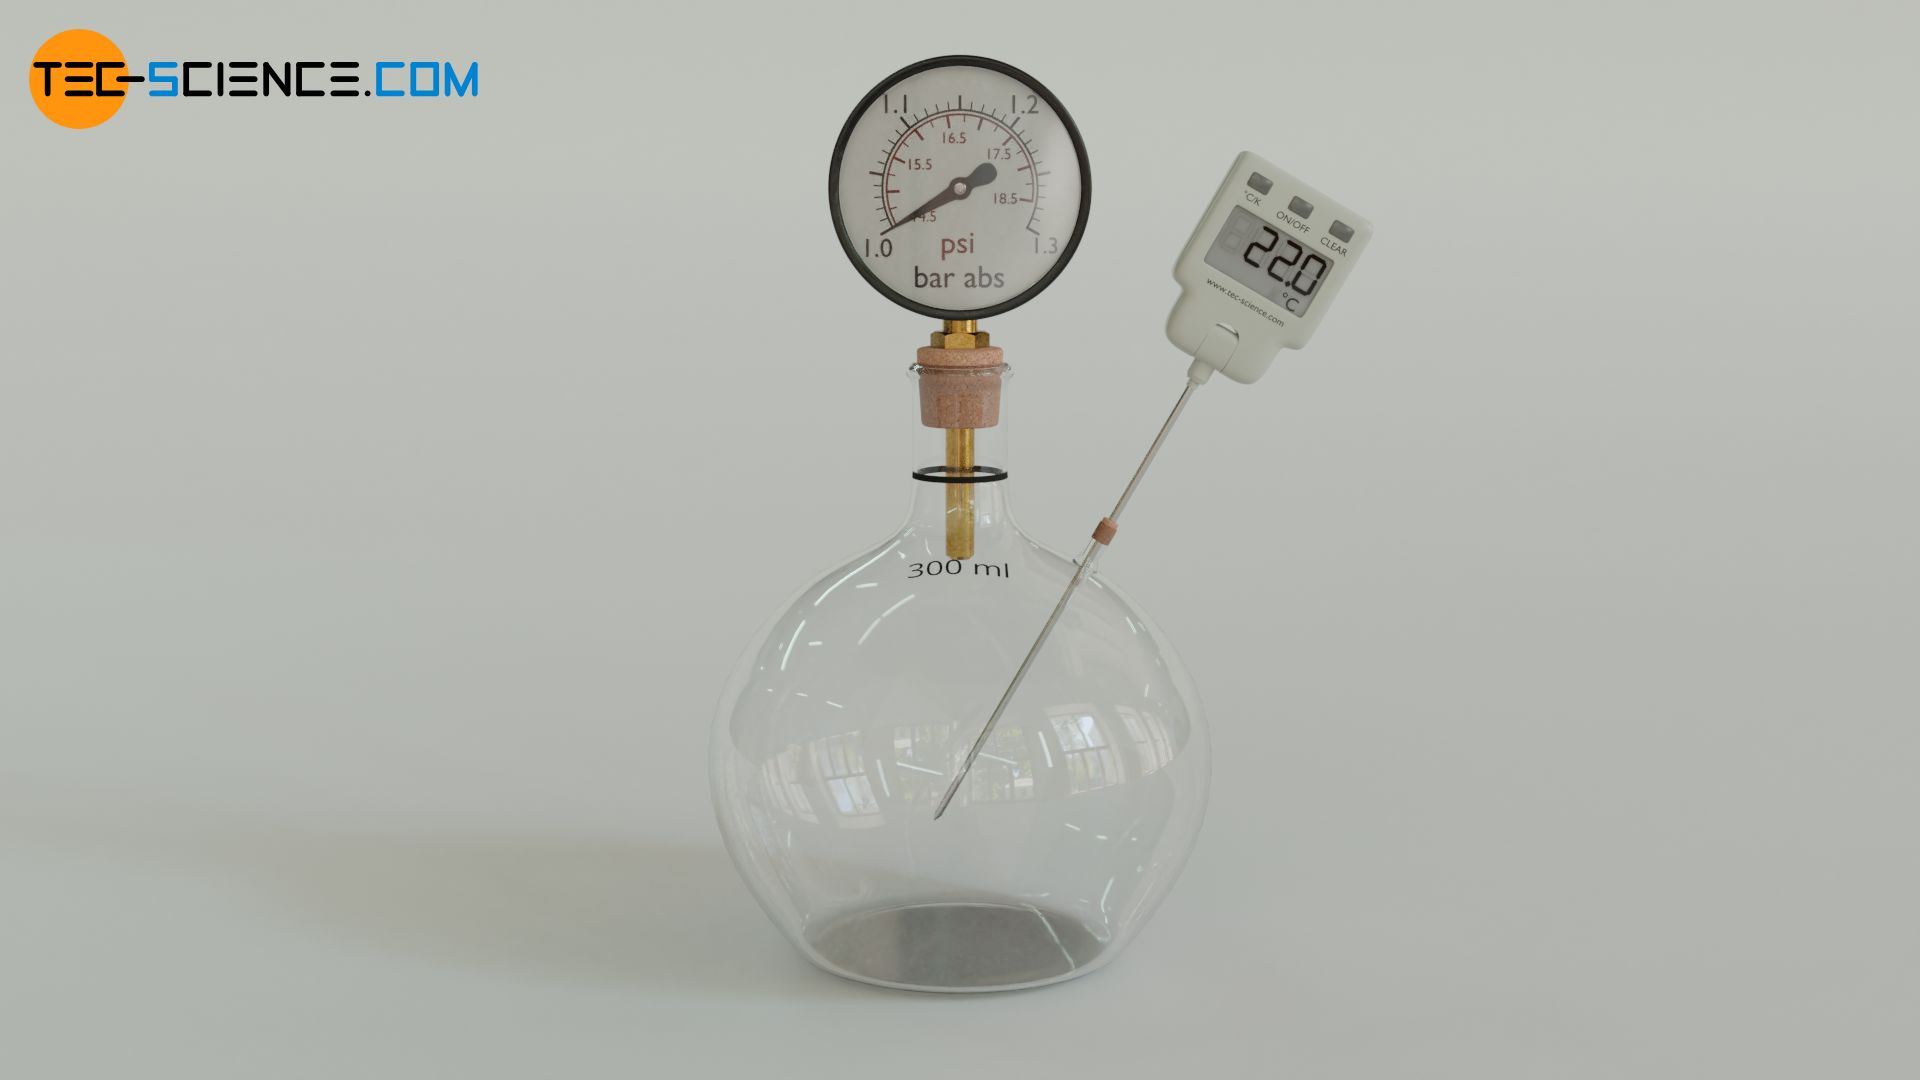
The temperature of the gas is set by heating the glas cylinder with a water bath. The resulting pressure, depending on the temperature, is read off the pressure gauge. In this way the dependence of pressure on temperature can be investigated at constant volume.
Linearity between pressure and temperature (unit: degrees Celsius)
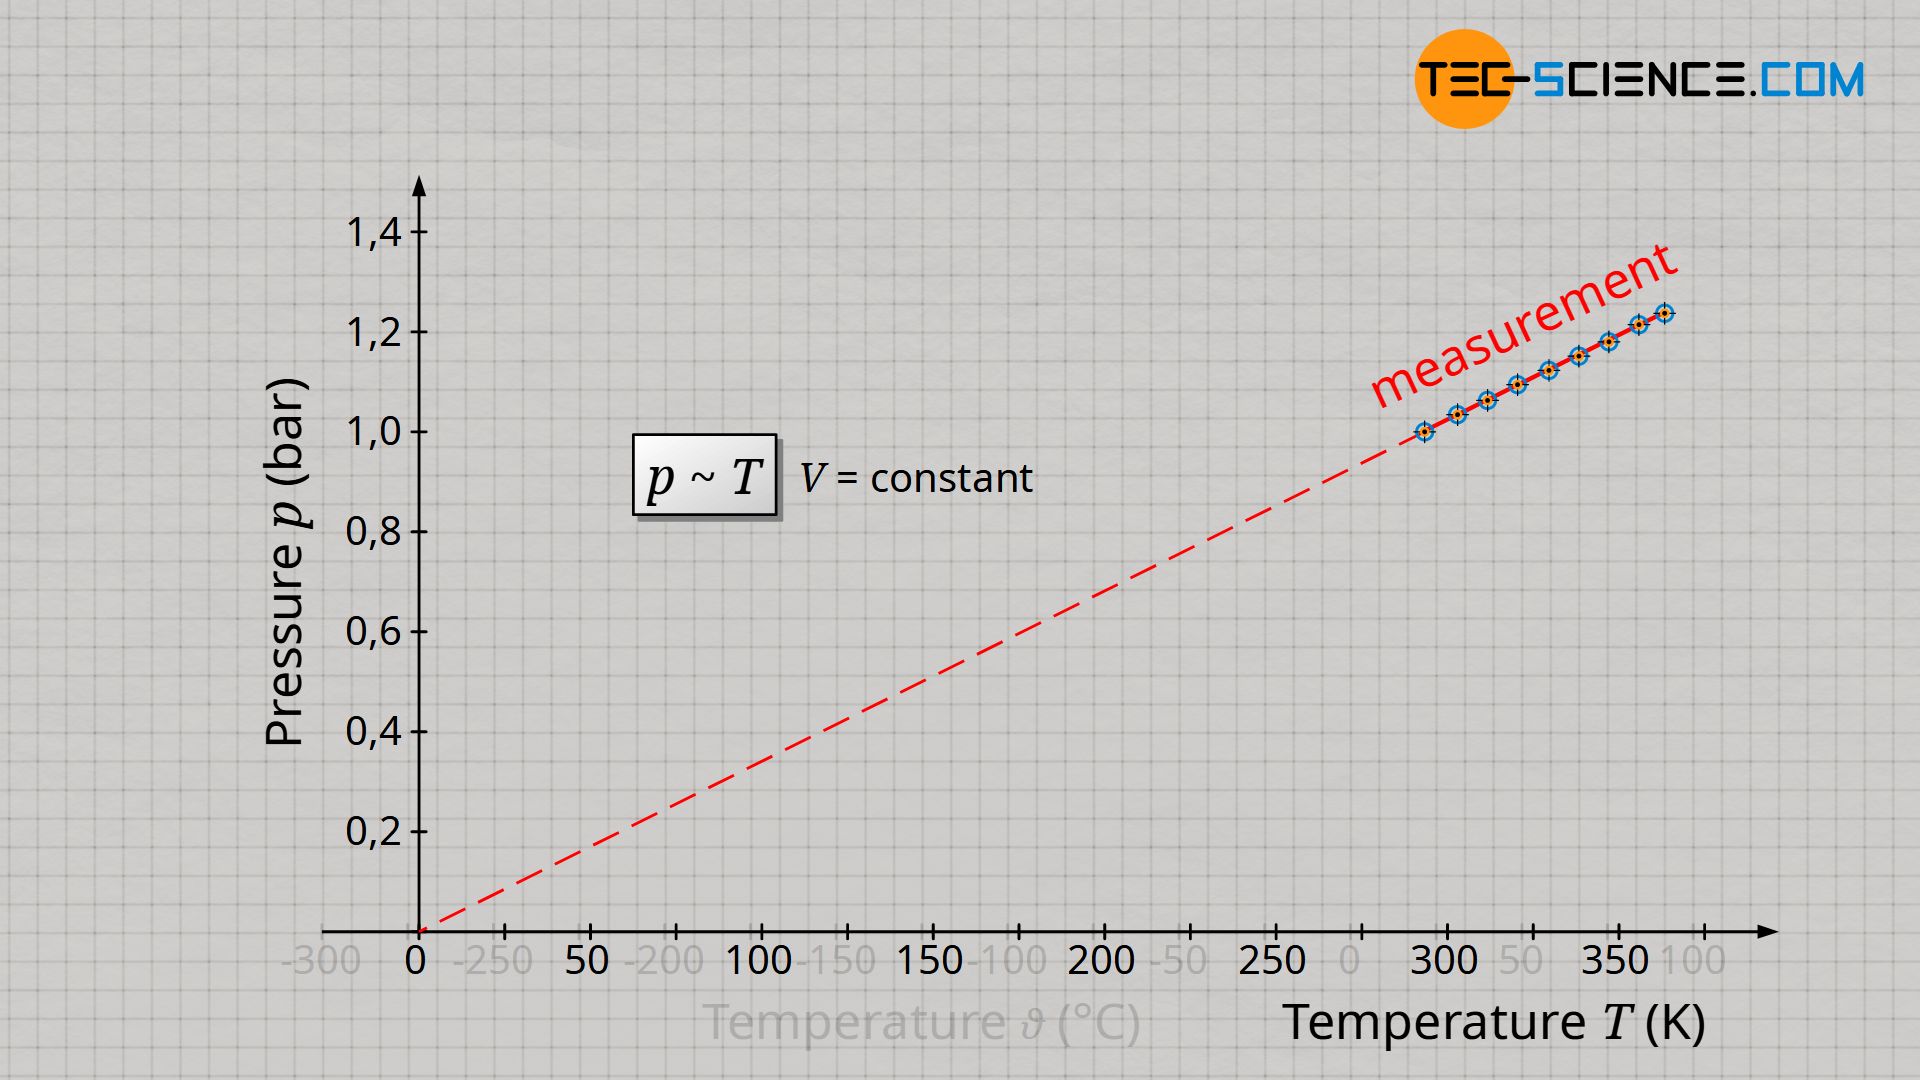
Already during the experiment one notices that the higher the temperature, the higher the pressure. For a more precise analysis it is useful to plot the measured values in a diagram. For this purpose, the pressure (unit: bar) is plotted against the temperature (unit: °C).
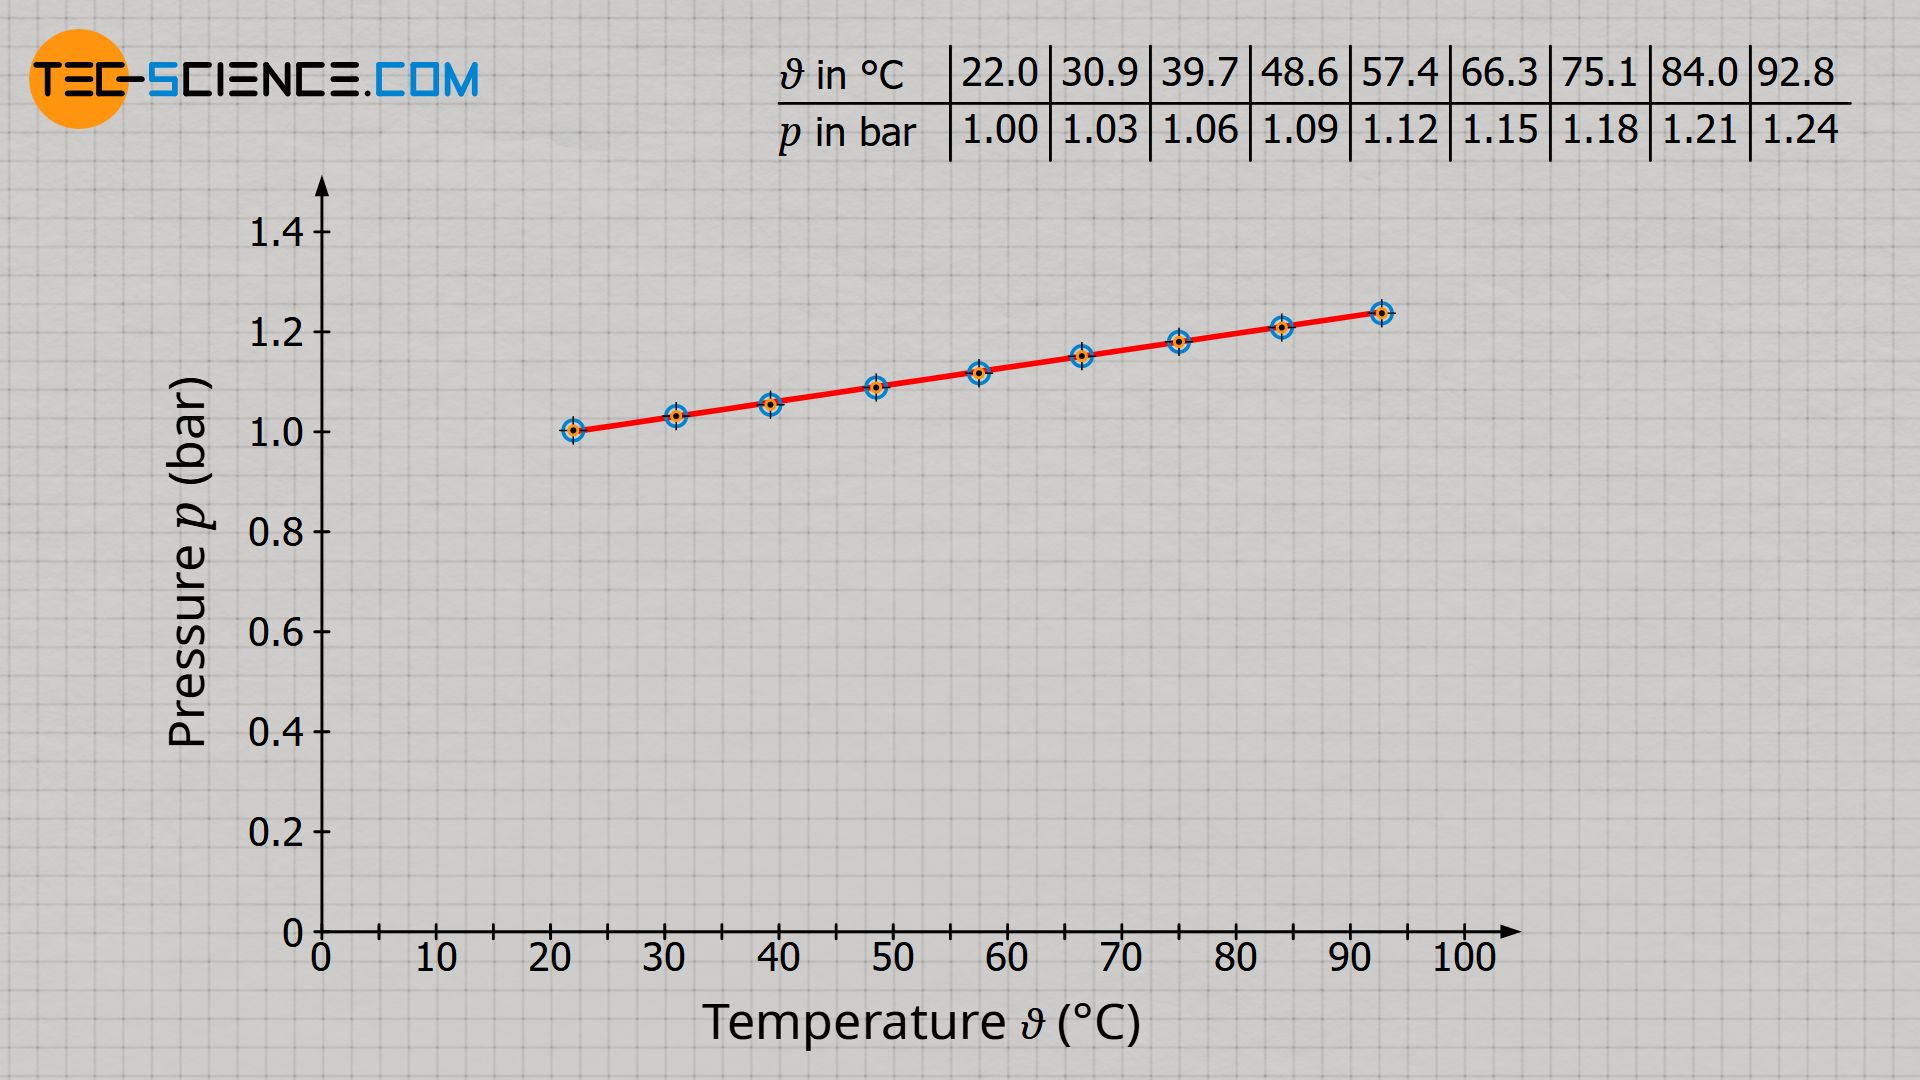
The diagram shows that pressure increases linearly with temperature. However, in this form there is no proportionality between the two quantities! Proportionality means that an increase of the one quantity causes an increase of the other quantity to the same extent. A tripling of the temperature should therefore also result in a tripling of the pressure. However, this is not the case! For example, at a temperature of 22 °C the pressure is 1 bar. However, a tripling of the temperature to 66 °C does not result in three times the pressure of 3 bar, but only a pressure of 1.15 bar (15 % increase). As long as the temperature is given in the unit degree Celsius, pressure and temperature are therefore not proportional to each other.
Proportionality between pressure and temperature (unit: Kelvin)
Pressure and temperature are only proportional to each other if the temperature is given in the unit Kelvin and not in degrees Celsius! This is no coincidence, since it was on the basis of this proportionality that the Kelvin scale was introduced (see article Temperature scales), because there is no particle motion and thus no pressure at absolute zero. Therefore this point became the reference point of the Kelvin scale (0 K = -273 °C).
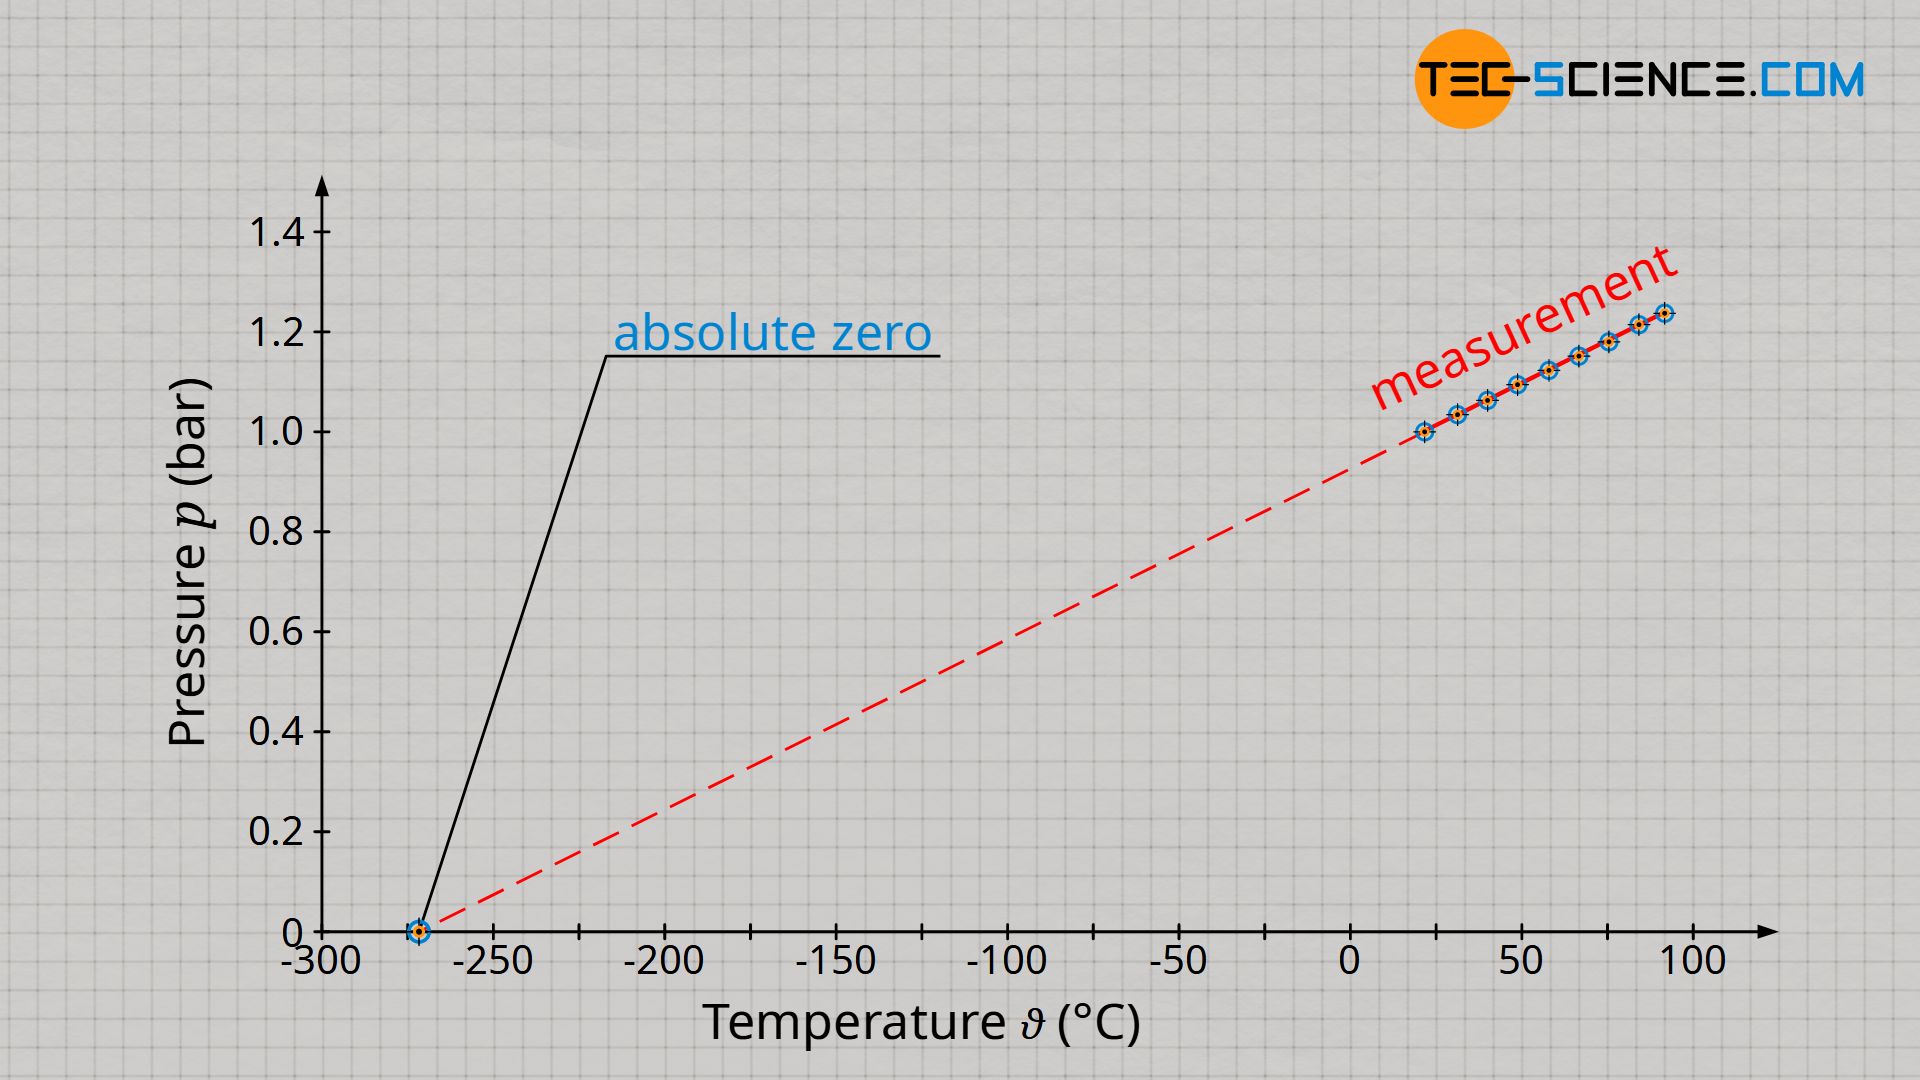
How can one basically distinguish in a diagram a proportionality of two quantities from a simple linearity? A proportionality in a diagram can always be recognized by the fact that the straight line goes through the origin! When pressure and temperature in the unit Kelvin are plotted, there is such a straight line through the origin (reference point of the Kelvin scale!). Only if the temperature is given in the unit Kelvin, a proportional relationship between pressure and temperature applies:
\begin{align}
&\boxed{p \sim T} ~~~~~\text{isochoric process of a closed system} \\[5px]
\end{align}
Conclusion
If, in the case of a proportional relationship between two quantities, one quantity increases to the same extent as the other quantity, then the quotient of both quantities is in any case constant. This statement can be verified using the values obtained from the experiment. For an isochoric process, the quotient of pressure and temperature is therefore always constant in any state of the gas:
| Temperatur ϑ in °C | 22.0 | 30.9 | 39.7 | 48.6 | 57.4 | 66.3 | 75.1 | 84.0 | 92.8 |
| Temperatur T in K | 295.2 | 304.3 | 313.4 | 322.6 | 331.7 | 340.8 | 350.0 | 359.1 | 368.3 |
| Druck p in bar | 1.00 | 1.03 | 1.06 | 1.09 | 1.12 | 1.15 | 1.18 | 1.21 | 1.24 |
| p/T in 10-3 bar/K | 3.4 | 3.4 | 3.4 | 3.4 | 3.4 | 3.4 | 3.4 | 3.4 | 3.4 |
\begin{align}
&\boxed{ \frac{p}{T}= \text{constant}}~~~~~ \text{law of Amontons} \\[5px]
\end{align}
The constancy of the quotient of pressure and temperature of an isochoric process was experimentally investigated by the physicist Guillaume Amontons. Therefore, this law is also known as Amontons’s law (also referred to as second law of Gay-Lussac).
Amontons’s law states that for an isochoric process of a closed system, the quotient of pressure and temperature is constant!
Linking two states of a gas
For an isochoric process, the quotient of pressure and temperature therefore has the same constant value in all states of the gas. Thus it is especially true that the quotient of pressure and temperature in any initial state 1 also corresponds to the quotient of pressure and temperature in any other final state 2:
\begin{align}
&\frac{p_1}{T_1} =\text{constant}= \frac{p_2}{T_2} \\[5px]
&\boxed{\frac{p_1}{T_1} = \frac{p_2}{T_2}} \\[5px]
\end{align}
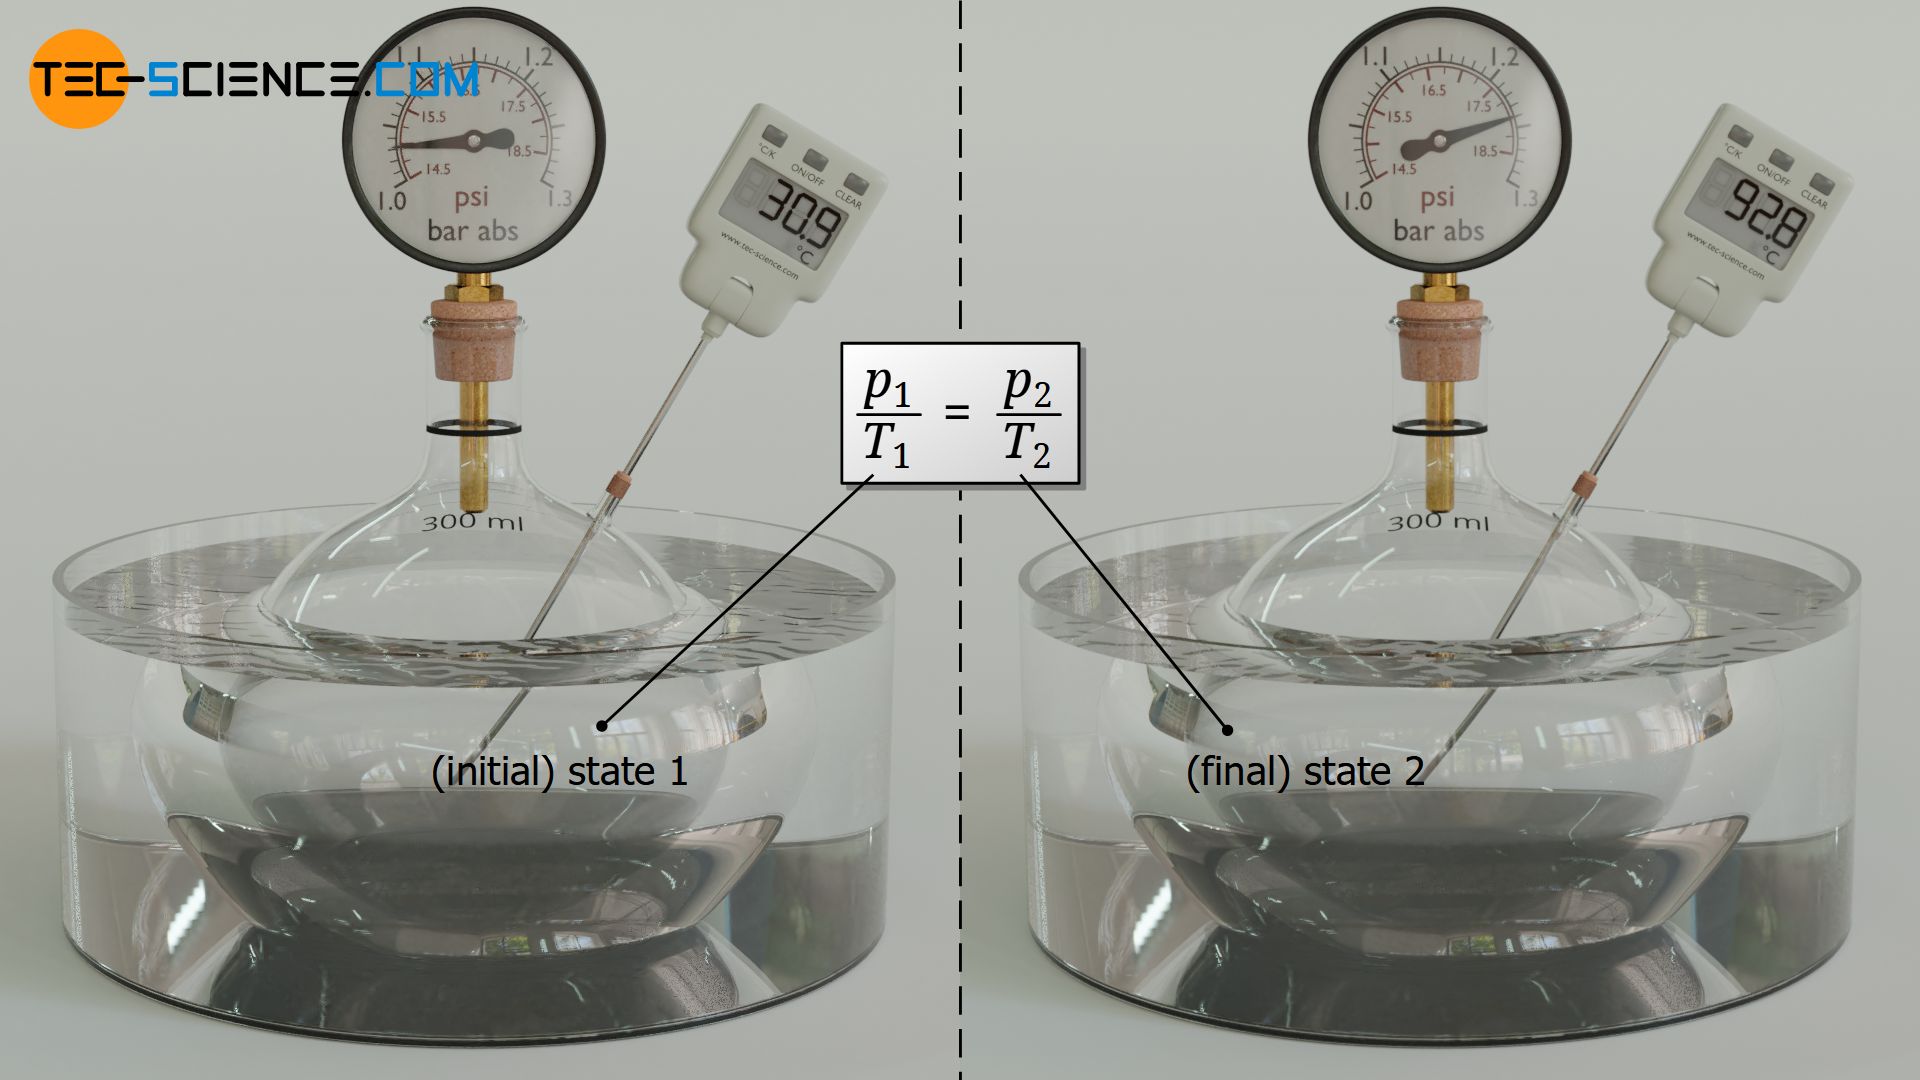
For an isochoric process of a closed system, two states of an ideal gas are linked by the quotient of pressure and temperature!
Connection to the ideal gas law
The relationship between two gas states shown above also results from the ideal gas law for the special case of a change of state at constant volume (V1=V2):
\begin{align}
\require{cancel}
&\frac{p_1 \cdot \cancel{V_1}}{T_1} = \frac{p_2 \cdot \cancel{V_2}}{T_2} \\[5px]
&\boxed{\frac{p_1}{T_1} = \frac{p_2}{T_2}} \\[5px]
\end{align}
The constancy of the quotient of pressure and temperature can also be derived directly from the ideal gas law. In the case that the volume does not change (V=konstant) and the system is closed (m=constant) the following statement applies:
\begin{align}
&\boxed{p \cdot V = R_\text{s} \cdot m \cdot T} ~~~~~\text{ideal gas law}\\[5px]
&\frac{p}{T} = \underbrace{R_\text{s} \cdot \frac{m}{V}}_{=\text{constant}} \\[5px]
&\underline{\frac{p}{T} =\text{constant}} \\[5px]
\end{align}
")


