Planck’s law of radiation can be expressed in different forms. The most important ones are discussed in this article.
Introduction
Planck’s law of radiation describes the radiation emitted by black bodies. However, there are different forms of representation, which will be discussed in more detail in the following. These differences are mainly due to the different quantities that are considered: e.g. intensity per wavelength or the intensity per solid angle or the energy density. Furthermore, these quantities can be considered either as a function of the wavelength or the frequency of the radiation.
Distribution of spectral intensity as a function of wavelength
The figure below shows the spectral intensity of the emitted radiation of a black body as a function of wavelength for different temperatures. The mathematical description of these curves has already been discussed in more detail in the article on Planck’s law:
\begin{align}
\label{planck}
&\boxed{I_s(\lambda) = \frac{2\pi h c^2}{\lambda^5} \cdot \frac{1}{\exp\left(\dfrac{h c}{\lambda k_B T}\right)-1} } ~~~\text{spectral intensity (wavelength form)} \\[5px]
\end{align}
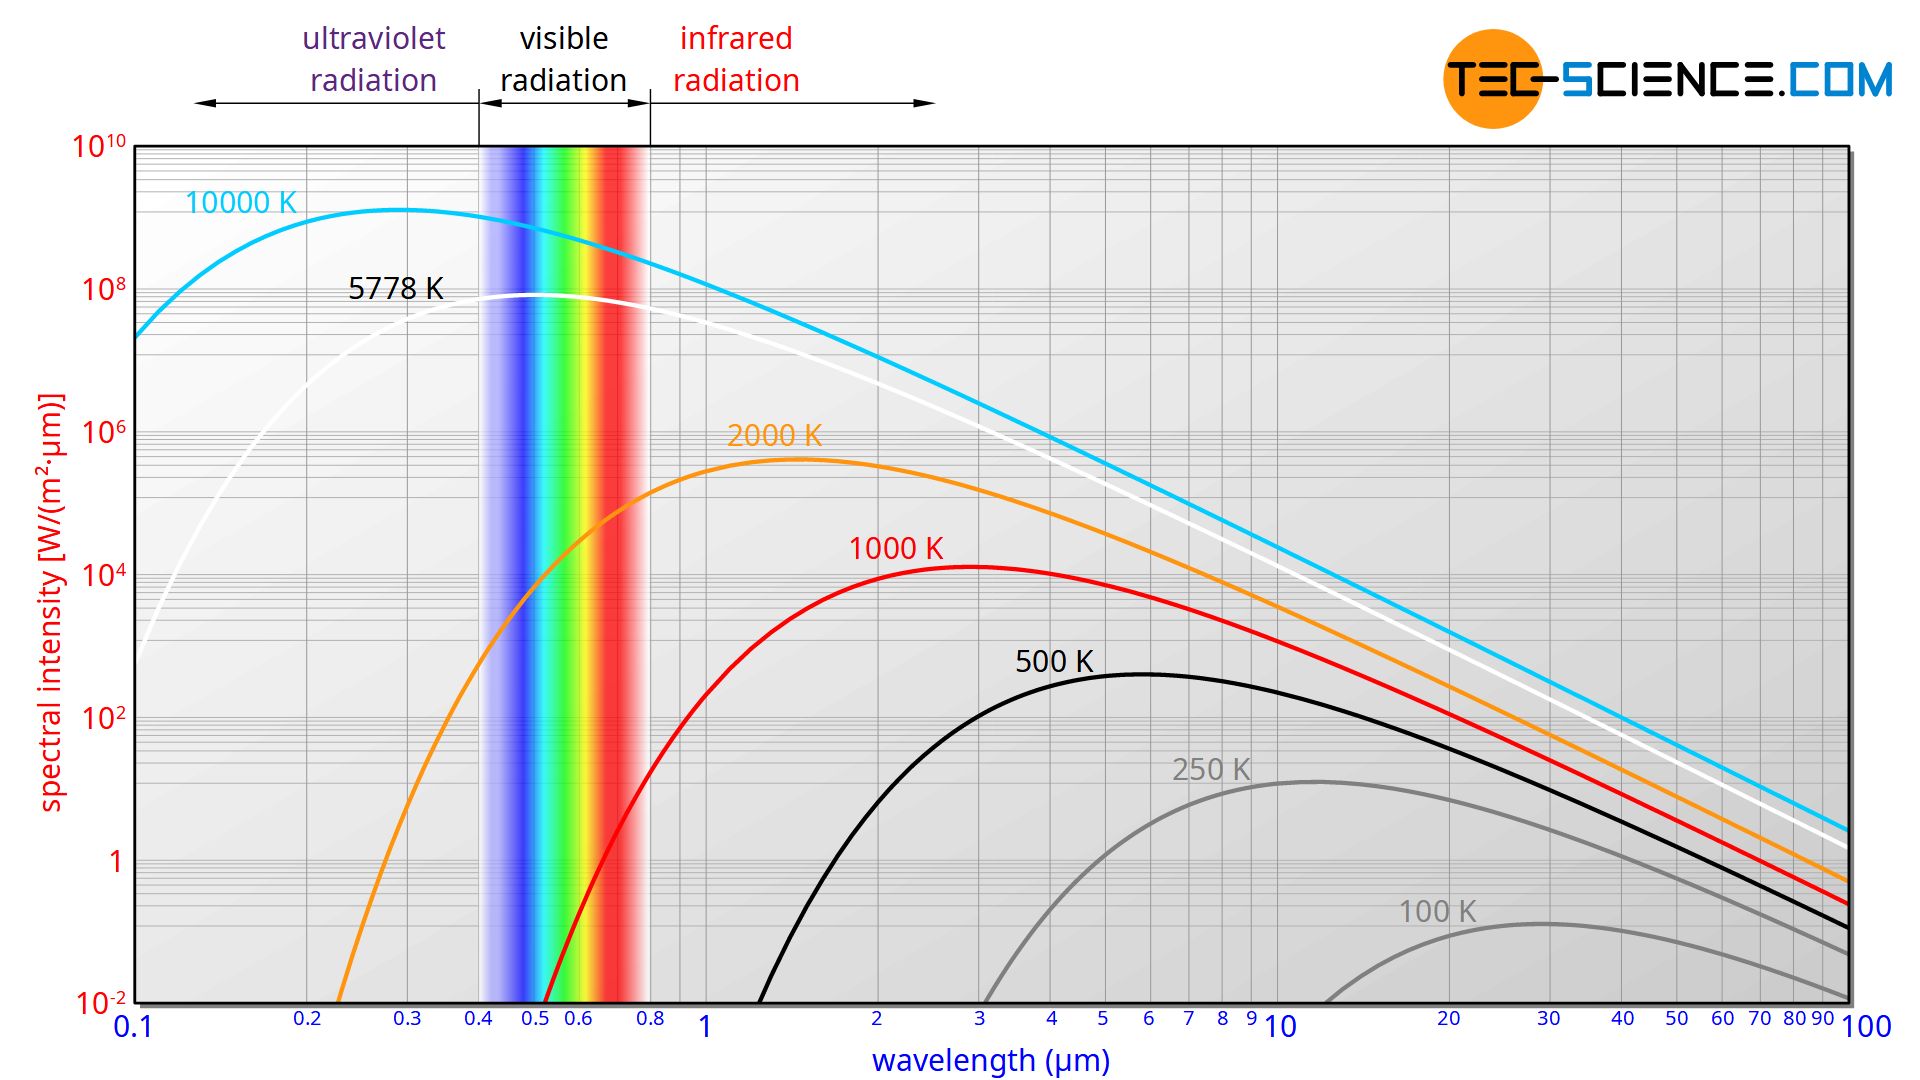
In this form of representation, the term intensity means a surface power density. The intensity thus indicates the radiant power of the black body, which it emits per unit area. Using the illustrative example of a light bulb, this would mean that for the calculation of its intensity, the radiant power is divided by the surface area of the light bulb. With a radiant power of 50 watts and a surface area of 100 cm², this would result in a radiation intensity of 0.5 W/cm² (“0.5 watts per square centimeter”).
Such an indication of the intensity does not, however, allow any statement as to whether the radiation emitted contains short wavelengths or long wavelengths. For our light bulb this would mean that no statement can yet be made on the basis of the intensity whether the light bulb emits its power more in the short-wave range and thus appears bluish or shines more strongly in the long-wave range and thus shines reddish.
In order to be able to examine the distribution of the wavelengths, the entire wavelength spectrum would first have to be divided into many small intervals. These wavelength intervals would then have to be examined separately from each other for their respective power. With the help of filters, such wavelength intervals could be separated from other wavelengths. The intensity with which the wavelength interval under consideration is present in the emitted radiation would then be determined by dividing the measured power by the size of the surface of the radiating body.
In this case, however, the measured power or intensity still depends decisively on the size of the chosen wavelength interval. To put it simply, this means: If you choose a wavelength interval twice as large, then twice as many wavelengths pass the filter and therefore twice as much power is measured (at least if the intervals are chosen very small). Therefore the measured power or intensity is related to the chosen wavelength interval! In this way one gets a constant intensity independent of the width of the wavelength interval. Such an intensity per unit wavelength interval ist finally called spectral intensity.
This spectral intensity is finally shown as a function of wavelength in the diagram. In this form of representation, the area under the curve corresponds to the radiated intensity in the wavelength range under consideration.
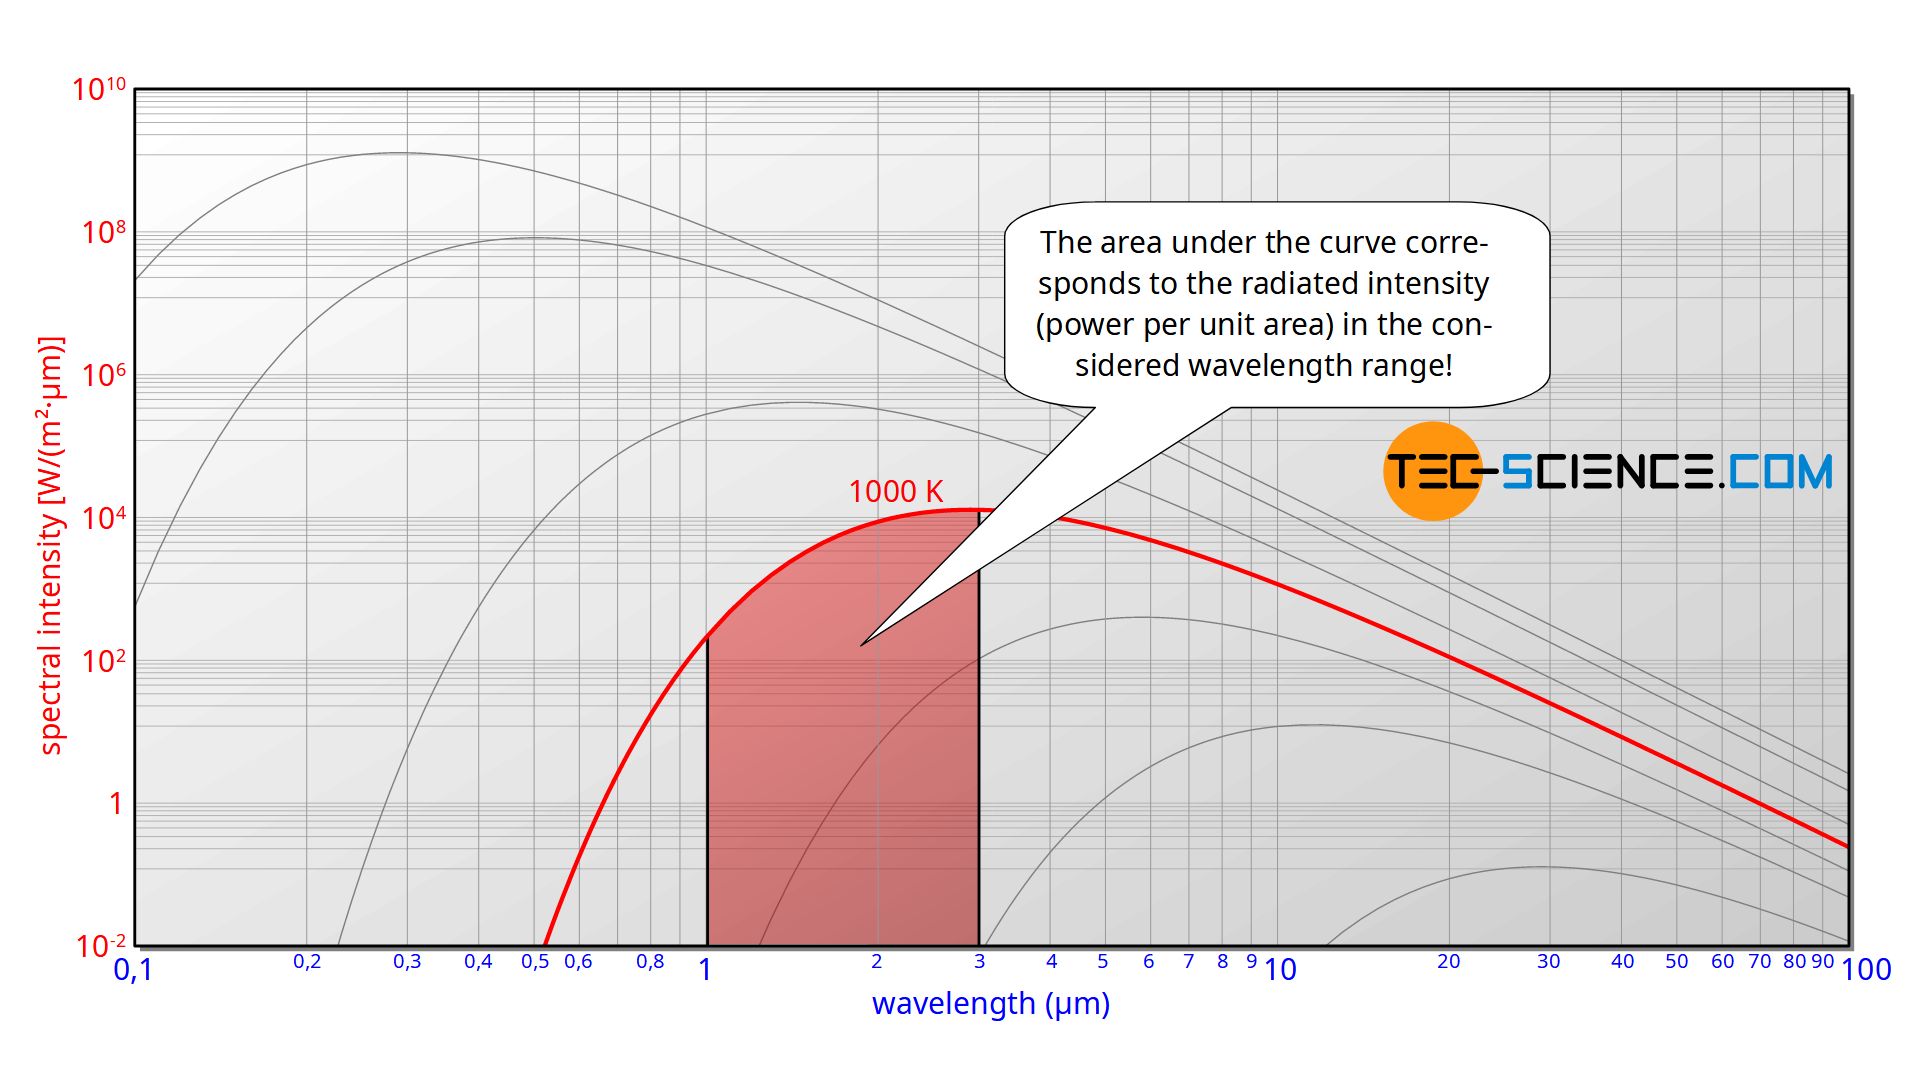
To determine the total intensity I with which the black body radiates, the spectral intensity I(λ) must therefore be integrated with respect to the entire wavelength spectrum from zero to infinity (total area under the curve):
\begin{align}
&\boxed{I=\int \limits_{\lambda=0}^\infty I_s(\lambda) ~\text{d}\lambda } ~~~\text{radiation intensity of a black body} \\[5px]
\end{align}
The intensity refers to the power per unit area. The total radiant power P of the black body is finally obtained by integrating the intensity over the entire surface A of the black body:
\begin{align}
&\boxed{P=\int\limits_{(A)} I ~\text{d}A = \int\limits_{(A)} \int \limits_{\lambda=0}^\infty I_s(\lambda) ~\text{d}\lambda ~\text{d}A} ~~~\text{radiant power of a black body} \\[5px]
\end{align}
If the black body emits radiation that is evenly distributed over its surface (isotropic black body), the intensity is equal at every point on the surface. In this case, the total radiated power is simply the product of intensity I and surface area of the black body A:
\begin{align}
&\boxed{P=I \cdot A} ~~~\text{radiant power of an isotropic black body} \\[5px]
\end{align}
The solution of the integrals shown above finally leads to Stefan-Boltzmann law, which describes the radiant power of a body as a function of its temperature. In the linked article you will find more information especially on this topic.
Distribution of spectral intensity as a function of frequency
Since wavelength λ and frequency f are related by the speed of propagation c (λ=c/f), Planck’s law of radiation can also be expressed as a function of frequency. However, the wavelength λ must not simply be replaced by the expression c/f. This has to do with the fact that the spectral intensity is a quantity related to the wavelength. Therefore, one also has to convert the wavelength intervals dλ into corresponding frequency intervals df!
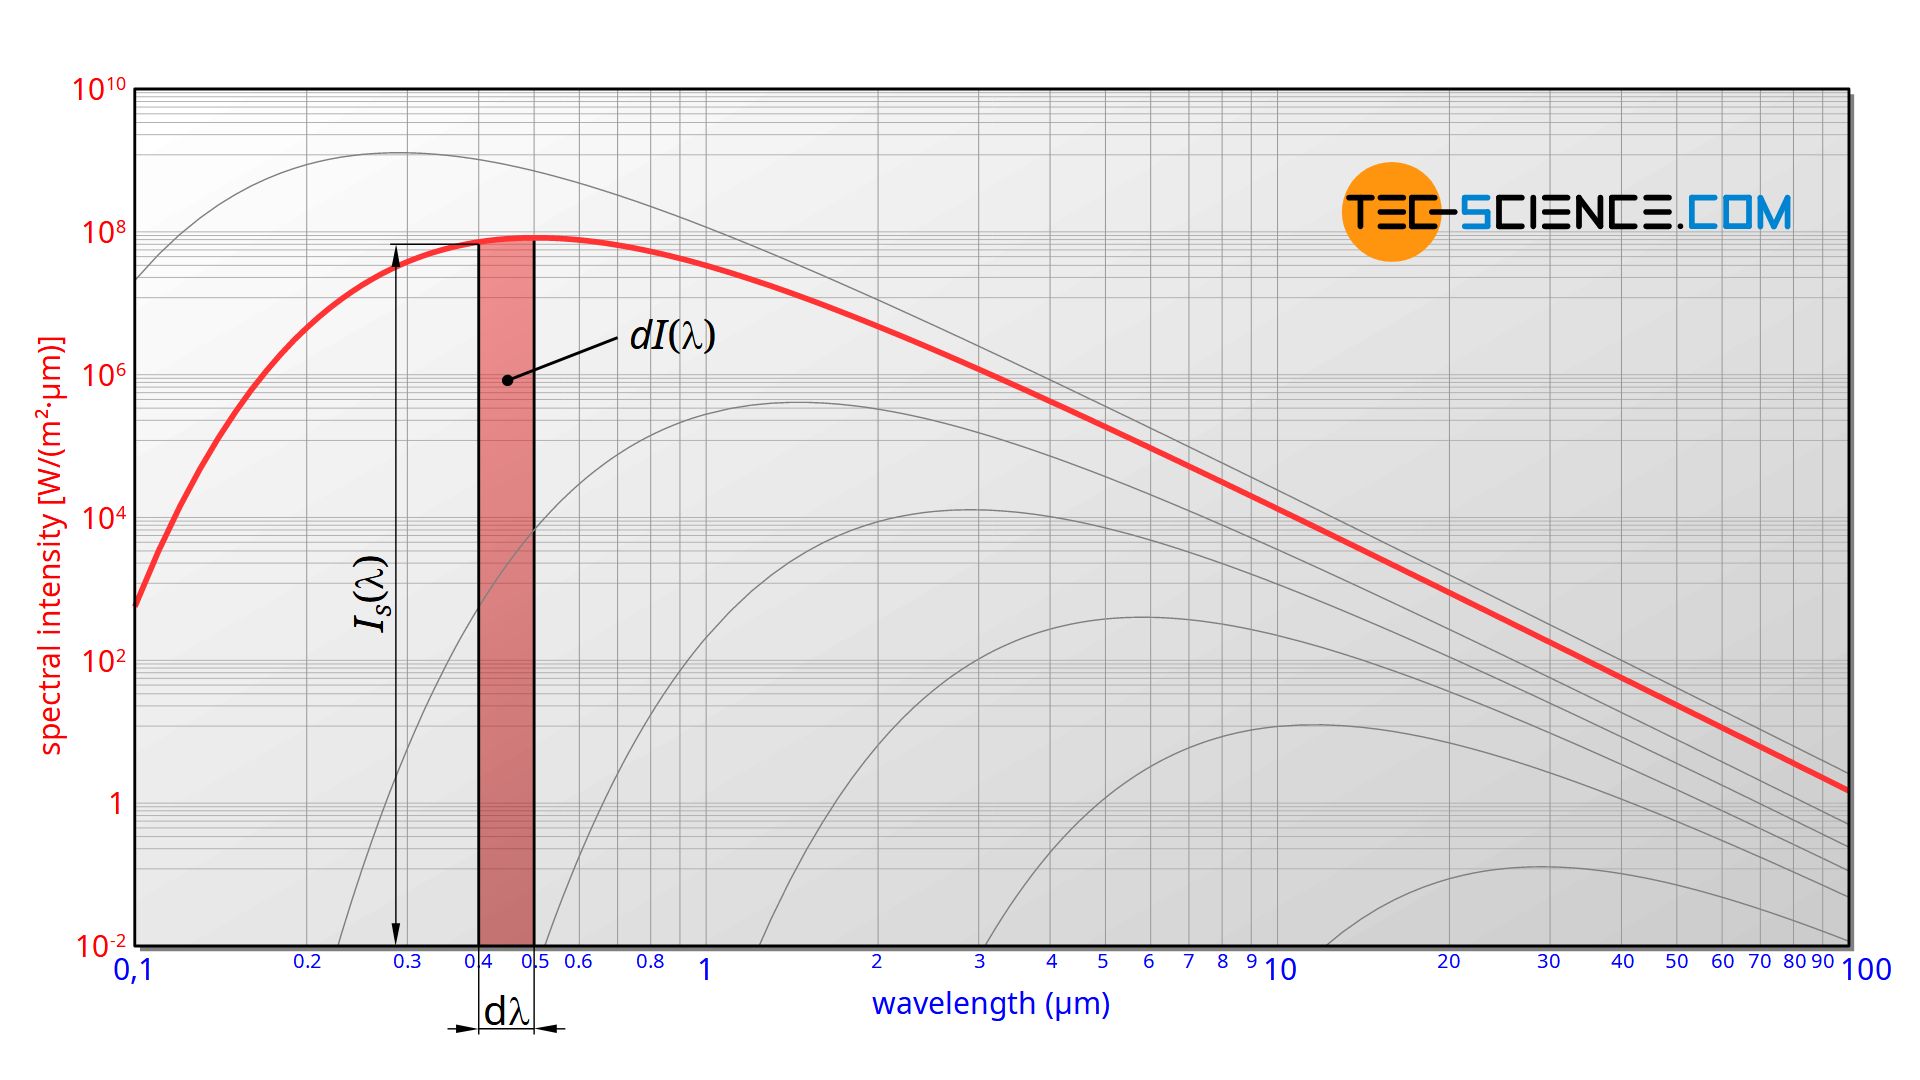
Only the radiated intensities are really comparable, but not the spectral intensities. The emitted intensity dI(λ) in a wavelength range between λ and λ+dλ is calculated by the product of the spectral intensity dI(λ) and the wavelength interval dλ (“area under the graph”):
\begin{align}
\label{c}
&\text{d} I(\lambda) =I_s(\lambda) \cdot \text{d}\lambda= \frac{2\pi h c^2}{\lambda^5} \cdot \frac{1}{\exp\left(\dfrac{h c}{\lambda k_B T}\right)-1} \cdot \text{d}\lambda \\[5px]
\end{align}
The wavelength interval dλ must therefore be assigned a corresponding frequency interval df. This is done by deriving the function f=c/λ with respect to the variable λ:
\begin{align}
\label{a}
&\boxed{f = \frac{c}{\lambda}} ~~~\text{or}~~~\boxed{\color{red}{\lambda=\frac{c}{f}}}\\[5px]
&\frac{\text{d}f}{\text{d}\lambda} = \frac{c}{-\lambda^2} \\[5px]
\label{z}
&\text{d}\lambda = – \frac{\lambda^2}{c} \cdot \text{d}f \\[5px]
\end{align}
The negative sign in equation (\ref{z}) merely expresses that an increase of frequency by df>0 results in a decrease of wavelength by dλ<0. At this point, however, only the magnitudes of the intervals are relevant, so that the negative sign can be omitted. Taking equation (\ref{a}) into account, one obtains:
\begin{align}
&\text{d}\lambda = \frac{\lambda^2}{c} \cdot \text{d}f = \frac{\left( \color{red}{\frac{c}{f}}\right)^2}{c} \cdot \text{d}f = \frac{c}{f^2} \cdot \text{d}f \\[5px]
\label{b}
&\boxed{\color{blue}{\text{d}\lambda = \frac{c}{f^2} \cdot \text{d}f}} \\[5px]
\end{align}
If now the equations (\ref{a}) and (\ref{b}) are used in equation (\ref{c}), then the spectral intensity Is(f) as a function of frequency is obtained:
\begin{align}
\text{d} I(f) &= \frac{2\pi h c^2}{\color{red}{\left(\frac{c}{f}\right)}^5} \cdot \frac{1}{\exp\left(\dfrac{h c}{\color{red}{\frac{c}{f}} k_B T}\right)-1} \cdot \color{blue}{\frac{c}{f^2} \cdot \text{d}f} \\[5px]
&= \frac{2\pi h c^2 f^5}{c^5} \cdot \frac{1}{\exp\left(\dfrac{h f}{ k_B T}\right)-1} \cdot \color{blue}{\frac{c}{f^2} \cdot \text{d}f} \\[5px]
&= \underbrace{\frac{2\pi h f^3}{c^2} \cdot \frac{1}{\exp\left(\dfrac{h f}{ k_B T}\right)-1}}_{I_s(f)} \cdot \text{d}f \\[5px]
\label{freq}
&\boxed{I_s(f) = \frac{2\pi h f^3}{c^2} \cdot \frac{1}{\exp\left(\dfrac{h f}{k_B T}\right)-1} } \\[5px]
\end{align}
For the conversion from the wavelength form to the frequency form of the spectral distribution the following relationship applies:
\begin{align}
&\boxed{I_s(f) =\frac{\lambda^2}{c} \cdot I_s(\lambda)} \\[5px]
\end{align}
Note, that when it comes to spectral intensity, it is no longer possible to simply convert the wavelength to a frequency by the formula f=c/λ. This is because wavelength and frequency behave reciprocally. Both quantities are therefore based on different interval widths! This will also play a role in the section Wien’s displacement law.
Distribution of the specific spectral intensity (spectral flux)
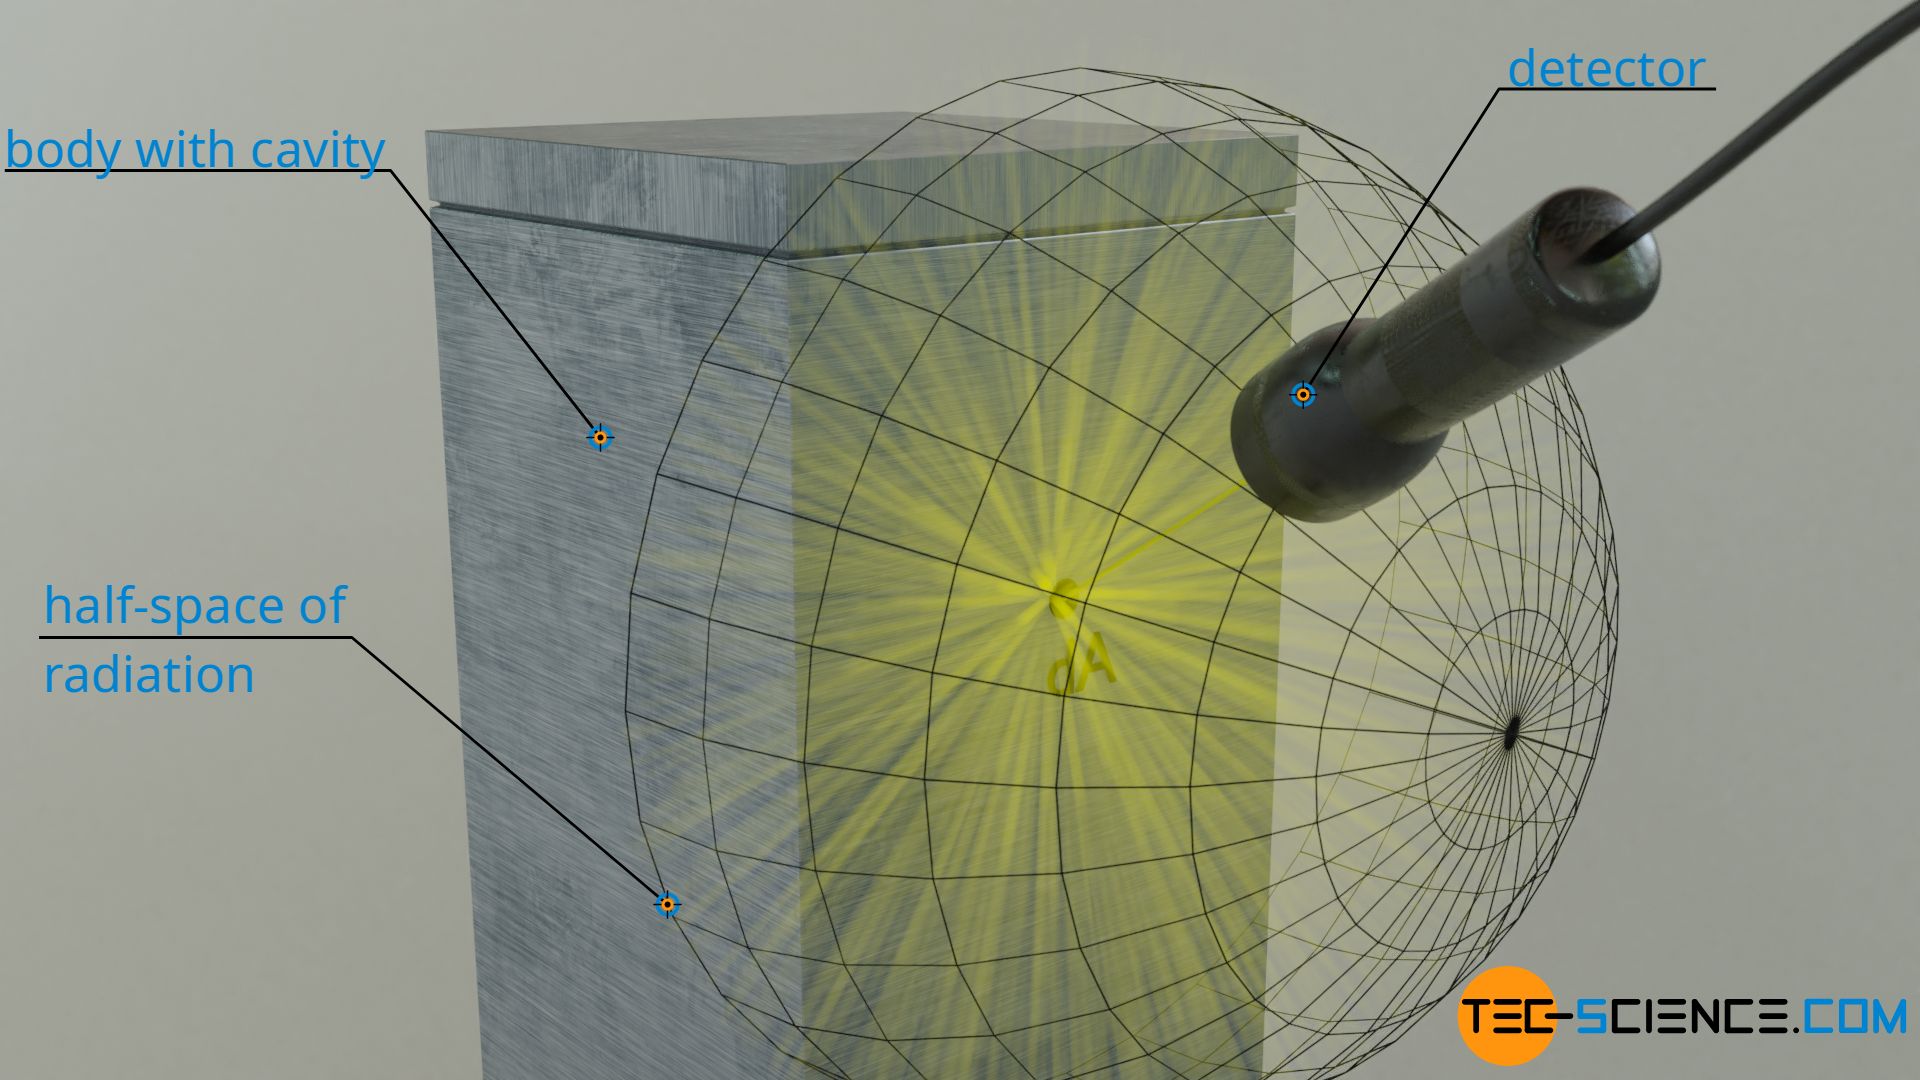
To experimentally determine the emitted spectral intensity of a surface element of a black body, the emitted radiation within a considered wavelength interval would have to be measured with a detector. In the article Blackbody radiation the realization of a blackbody by means of an opening leading into a cavity has already been described in detail. In this case, the surface element to be examined would correspond to the area of the opening, which completely absorbs incident radiation and thereby emits blackbody radiation itself (also called cavity radiation). The radiation propagates spherically into the half-space (see figure below).
Influence on the measured radiant power: The ” direction of view”
For the measurement of the emitted radiant power, however, it is not sufficient to place the detector somewhere in a fixed position where only a part of the radiation is detected. One has to detect the radiation around the whole half space to actually measure the total radiant power. However, the radiant power of the surface element (here: area of the opening) is not the same in all directions! Thus, one cannot assume that the power measured with the detector at one place is the same at another place.
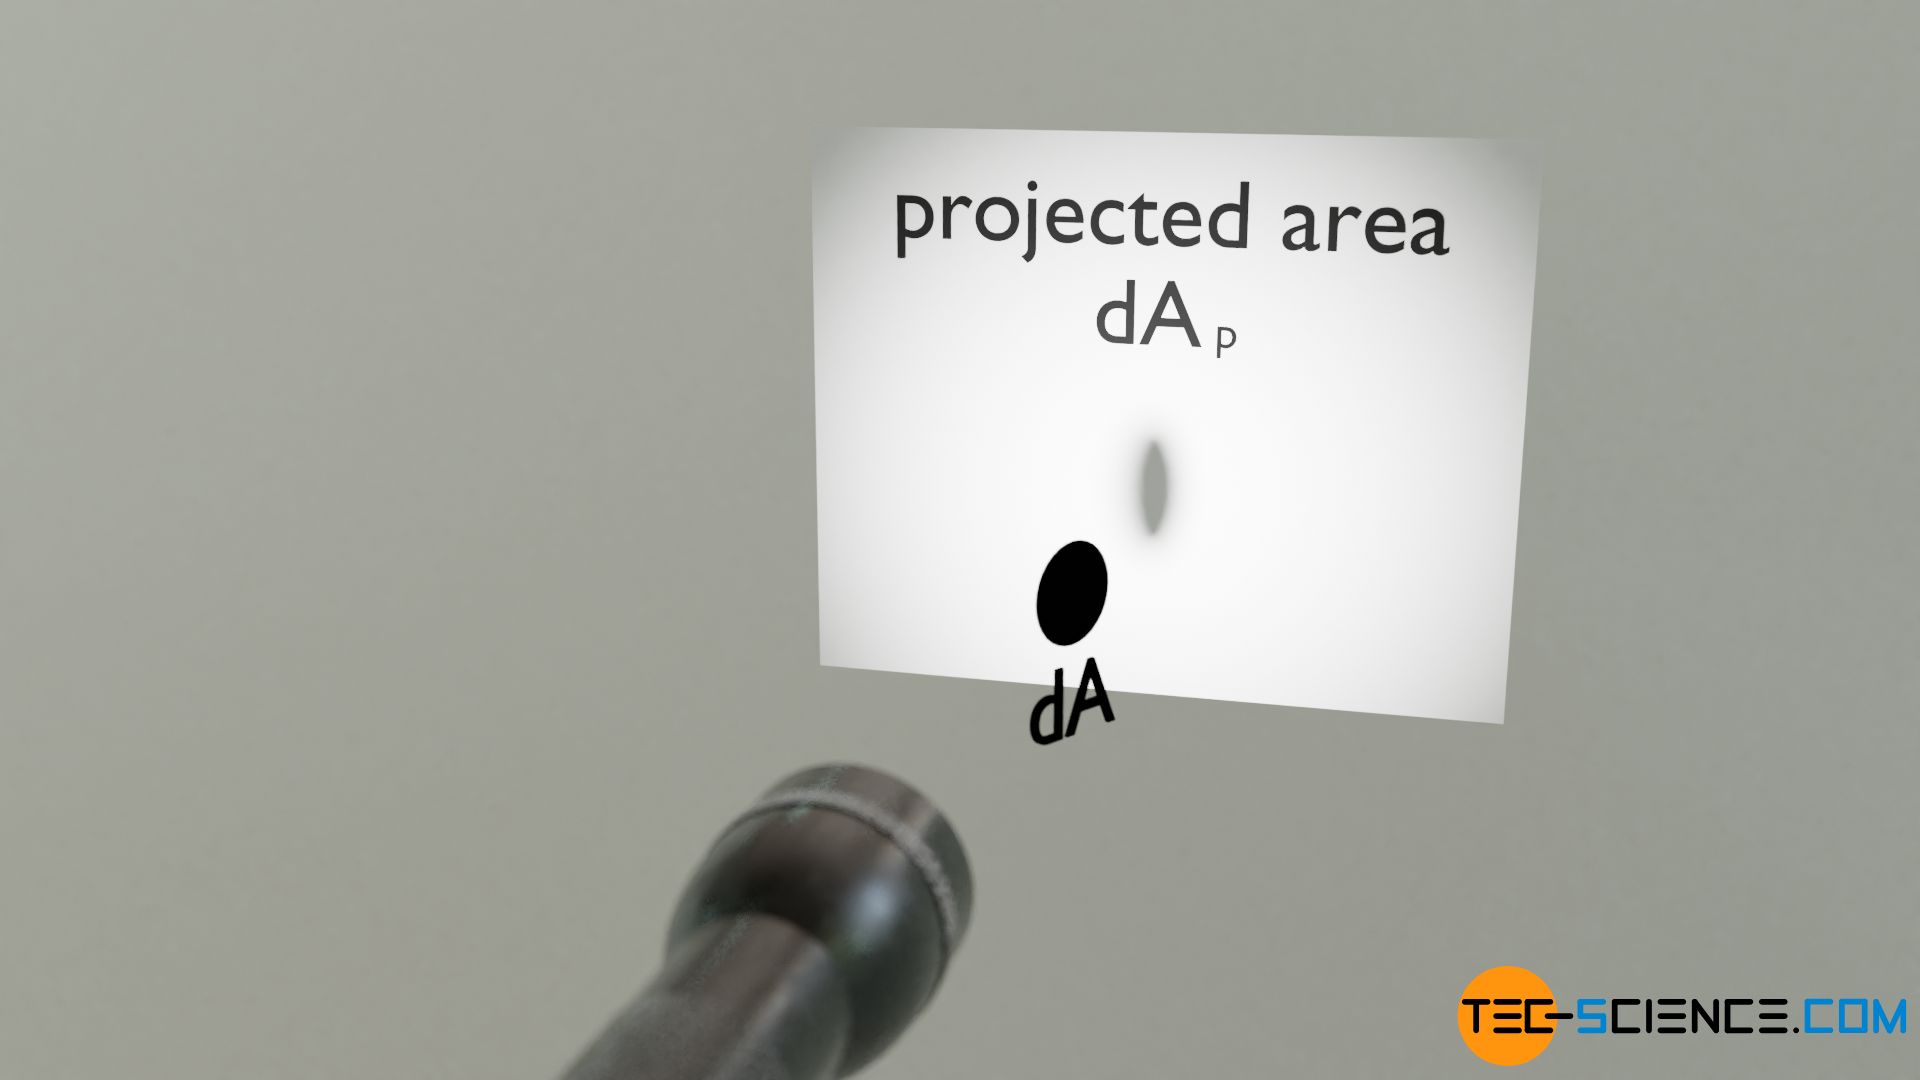
Everyday experience already shows that the radiant power of a (flat) surface element is dependent on direction. Imagine a large glowing metal plate. If you look at this plate frontally, you will perceive a relatively strong thermal radiation (this thermal radiation is part of blackbody radiation!) The radiant power is therefore relatively high when looking at the plate from the front. If you look at the glowing plate from the side, however, the thermal radiation appears less intense. This means that the radiant power is lower. This can be explained by the fact that the plate appears much smaller when viewed from the side and thus has a less effective radiating surface. Obviously, the area appearing in the viewing direction, the so-called projected area, has an influence on the perceived or measured radiant power.
The projected area can be clearly illustrated by imagining the detector as a “flashlight”. The shadow that the illuminated surface element then creates on a screen placed behind it corresponds to the projected area.
Influence on the measured radiant power: The solid angle
On the one hand, the direction in which the the detector is pointing is therefore relevant for the measured radiation power and on the other hand, of course, the area the detector occupies (its “field of view”, so to speak). The latter is expressed by the so-called solid angle. A solid angle Ω is defined by the ratio of an area on a sphere A to the square of the radius of the sphere r²:
\begin{align}
\label{r}
&\boxed{\Omega =\frac{A}{r^2}} ~~~\text{solid angle} \\[5px]
\end{align}
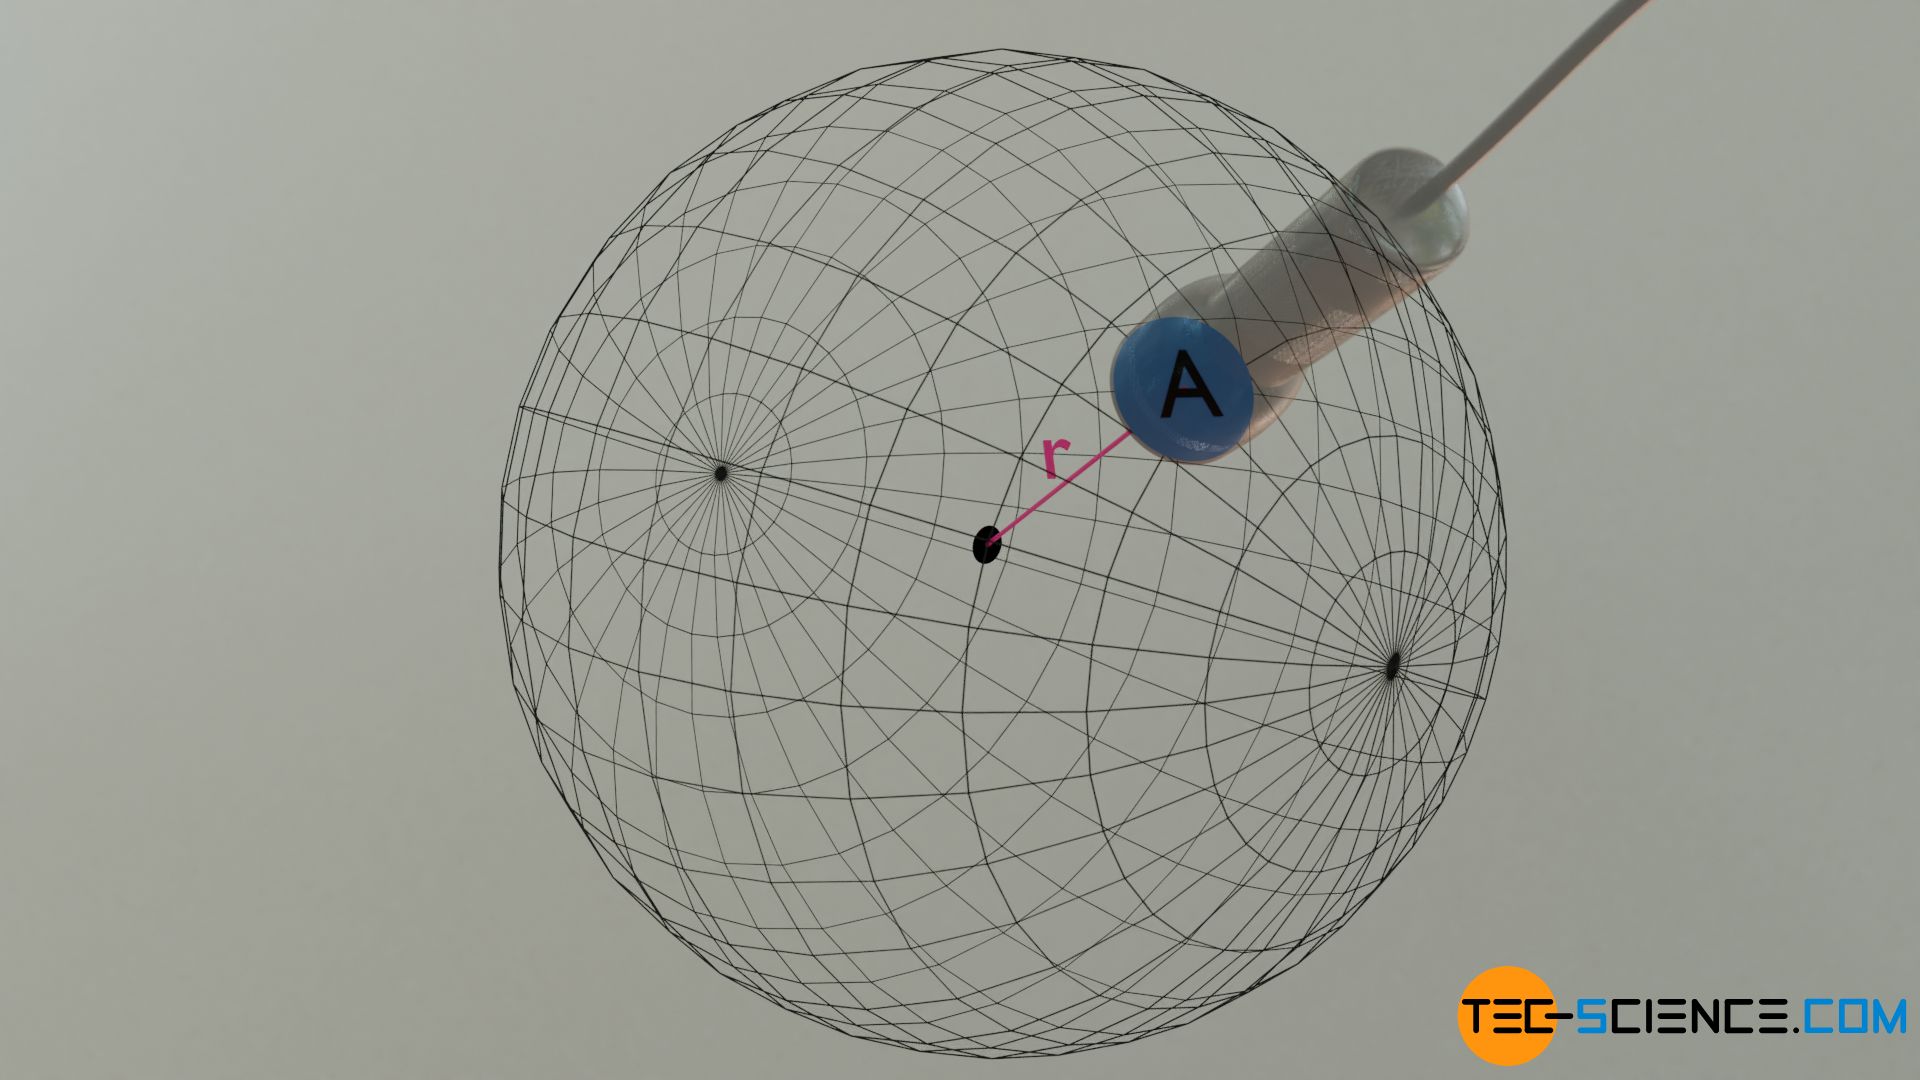
The solid angle can be understood analogously to the radian. In two-dimensional space, the radian is the ratio of the length of an arc to the radius of the circle. In three-dimensional space, the solid angle is the ratio of a segment of the sphere to the square of the radius of the sphere.
If a segment includes the entire sphere surface with an area of 4π⋅r², then a solid angle of 4π is obtained. The angle occupies the entire space of the sphere, so to speak. If the area is only half the entire sphere surface, the solid angle is 2π. For such an solid angle of 2π, the detector would just cover the entire half-space of radiation and detect the entire radiant power of the surface element. The detector would also have to be hemispherical.
Note: As long as a considered segment is part of a spherical surface, a solid angle can be defined for any arbitrarily shaped surface according to the equation (\ref{r}). The outline of the surface does not necessarily have to form a circle as is often suggested in order to specify a solid angle! In other words: Our detector does not need a circular sensor, it can also be rectangular or otherwise arbitrarily shaped. It only needs to be part of a spherical surface. For large radii and small surfaces, however, the curvature of the surface is so small that flat surfaces can be used in very good approximation.
Spectral intensity per solid angle (spectral flux)
If one examines the emitted radiant power of the opening of the cavity acting as a blackbody with a detector, then one observes two things:
- the measured radiant power dP is proportional to the area projected in the direction the detector is pointing dAp,
- the measured radiant power dP is proportional to the solid angle dΩ the detector covers (as long as small solid angles are considered).
Point (1) has already been explained: the larger the radiating surface facing the detector, the greater the power. Point (2) can also be clearly understood. If two very small detectors are placed directly next to each other, they both register the same power. If one takes both detectors together in thought, which then take up twice the solid angle, then one obviously receives twice the power. Strictly speaking, this applies only as long as the two solid angles are very small and the surface segments are close together, so that they do not differ in the direction of pointing. Otherwise, according to point (1), one of the detectors would measure a slightly different radiant power.
Furthermore, the measured radiant power is of course dependent on the size of the wavelength interval dλ, which the filter of the detector allows to pass. A wavelength interval twice as large means that twice as much radiation passes through the filter. The measured power is therefore twice as large. This proportionality between power and wavelength interval only applies to very small wavelength intervals. For a given wavelength range between λ and λ+dλ, the above relationships can be mathematically represented as follows:
\begin{align}
& \text{d}P \sim \text{d}\Omega \cdot \text{d}A_p \cdot \text{d}\lambda \\[5px]
\label{p}
&\frac{ \text{d}P}{\text{d}\Omega \cdot \text{d}A_p \cdot \text{d}\lambda} =\text{konstant} = B_s \\[5px]
\end{align}
Thus, if the radiant power of a black body is no longer related only to a wavelength interval and to a surface element as with the spectral intensity Is, but next to the wavelength interval dλ to the solid angle dΩ and to the projected area dAp, then one also obtains a constant quantity. This quantity is called specific spectral intensity or spectral flux Bs. The spectral flux thus represents the radiant power emitted per unit wavelength interval and per unit solid angle and per unit projected area.
Spectral flux is the radiant power of a projected surface element per unit of solid angle and per unit of wavelength interval!
Applied to our example this means: No matter at what distance and with what orientation the detector faces the surface element of the black body, the same value Bs is measured for a certain wavelength interval. Thus, the radiation of a blackbody can also be characterized by exactly this quantity Bs. In practice, this quantity has the advantage that one does not need the entire emitted radiation of a surface element to characterize the radiation, as is the case with the spectral intensity. With the spectral flux, only a part of the radiation within a certain solid angle needs to be examined.
The following formula applies to the spectral flux Bs depending on the wavelength or frequency:
\begin{align}
\label{bs}
&\boxed{B_s(\lambda) = \frac{2 h c^2}{\lambda^5} \cdot \frac{1}{\exp\left(\dfrac{h c}{\lambda k_B T}\right)-1} } ~~~\text{wavelength form} \\[5px]
\end{align}
\begin{align}
&\boxed{B_s(f) = \frac{2 h f^3}{c^2} \cdot \frac{1}{\exp\left(\dfrac{h f}{k_B T}\right)-1} } ~~~\text{frequency form} \\[5px]
\end{align}
Relationship between spectral intensity and spectral flux
If one looks at the formulas (\ref{planck}) and (\ref{bs}), they obviously differ only by the factor π. How this relationship comes about will be explained in the following. First of all, it should again be pointed out that the spectral flux Bs indicates the radiation intensity per unit solid angle, whereas the spectral intensity Is refers to the total radiation intensity. Since an (infinitesimal) surface element radiates spherically into half-space, the spectral flux Bs must be added up over the entire half-space, so to speak, to calculate the spectral intensity Is. For the spherical half-space the solid angle is 2π. Therefore, shouldn’t both quantities differ by 2π instead of only by π?
When summing-up over the half-space, it must be noted that the spectral flux does not refer to the full area of the surface element, but only to the projected area. However, both areas are only identical for the special case when the surface element is viewed from the front. Otherwise the projected area is always smaller. On average over all solid angles, the projected area is half as small as the area itself. Therefore the result is not 2π, but only π. In the following, this will also be shown mathematically.
Mathematically, the summation corresponds to the integration of the spectral flux over the radiation hemisphere:
\begin{align}
\text{d}P &= \text{d}P \\[5px]
I_s \cdot \text{d}A \cdot \text{d}\lambda &= \int\limits_{(A)} B_s \cdot \text{d}A_p \cdot \text{d}\Omega \cdot \text{d}\lambda \\[5px]
\label{l}
I_s \cdot \text{d}A &= \int\limits_{(A)} B_s \cdot \text{d}A_p \cdot \text{d}\Omega \\[5px]
\end{align}
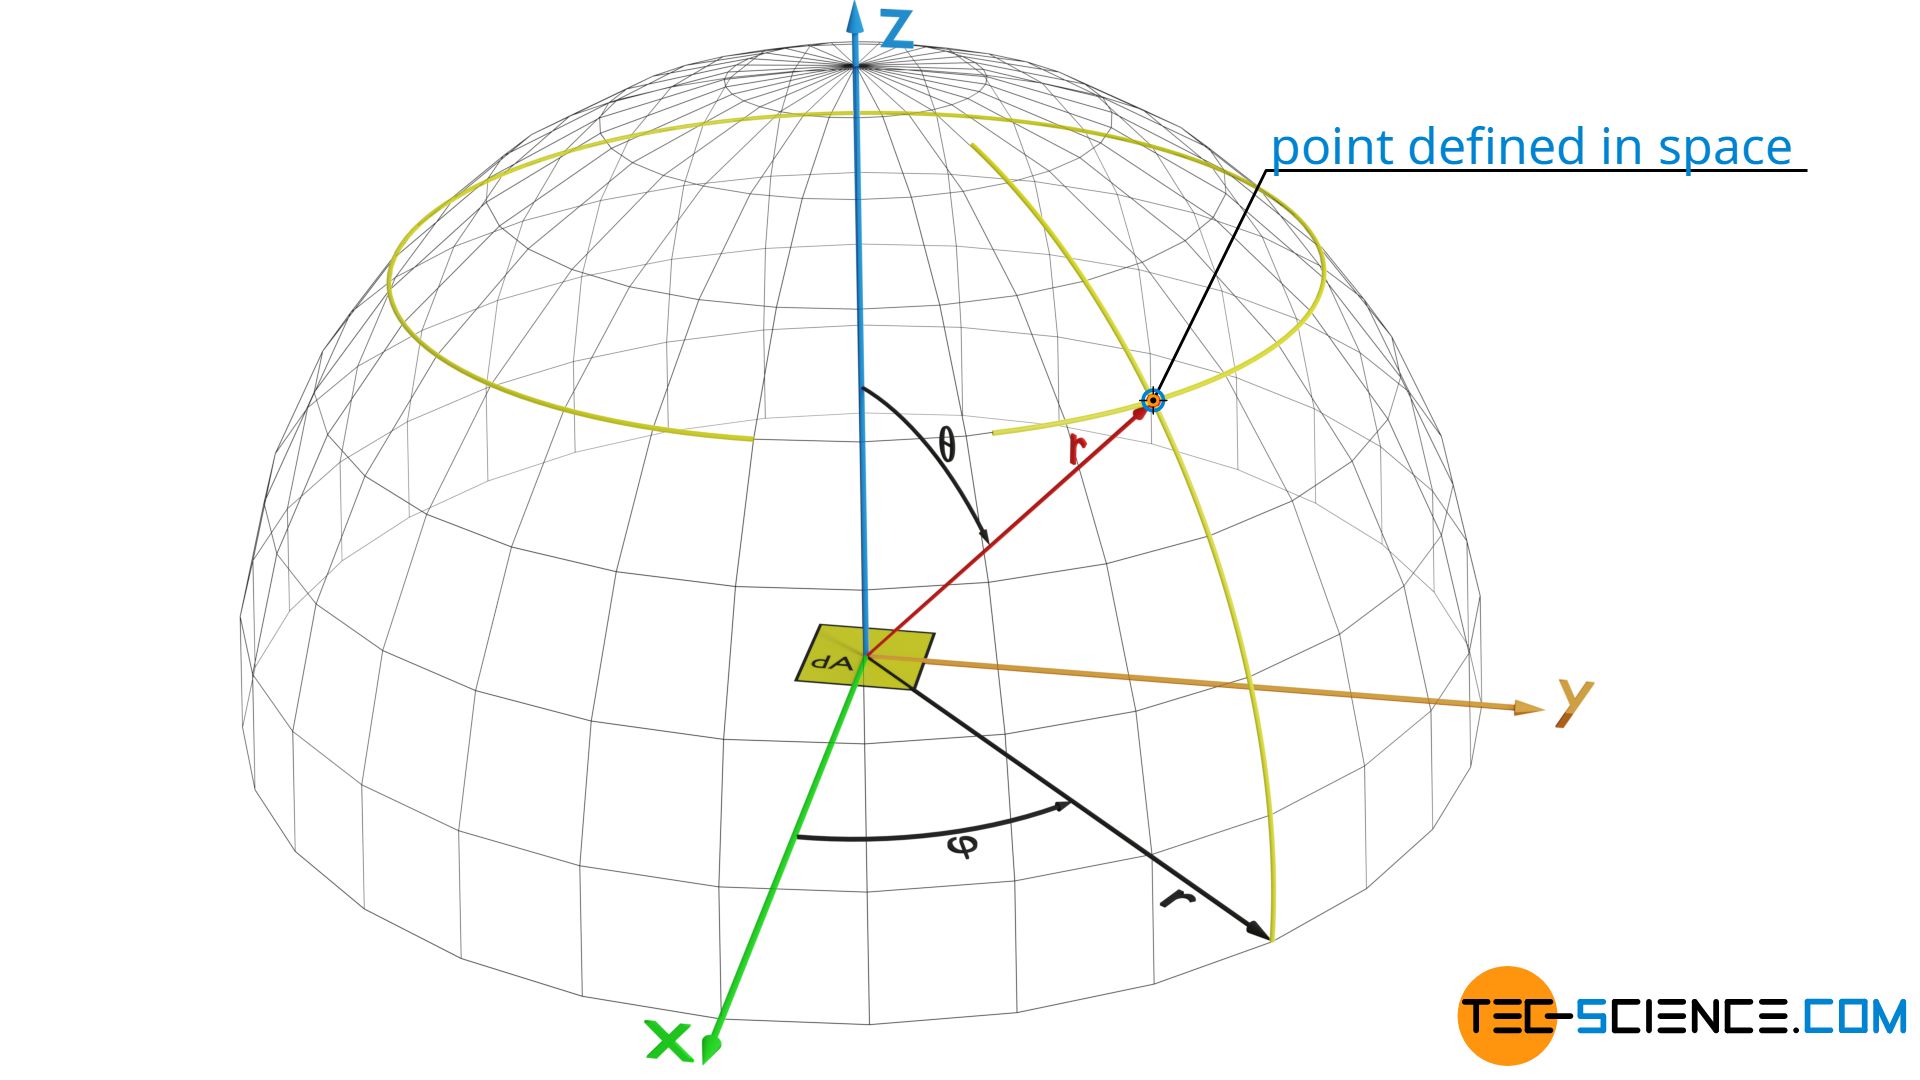
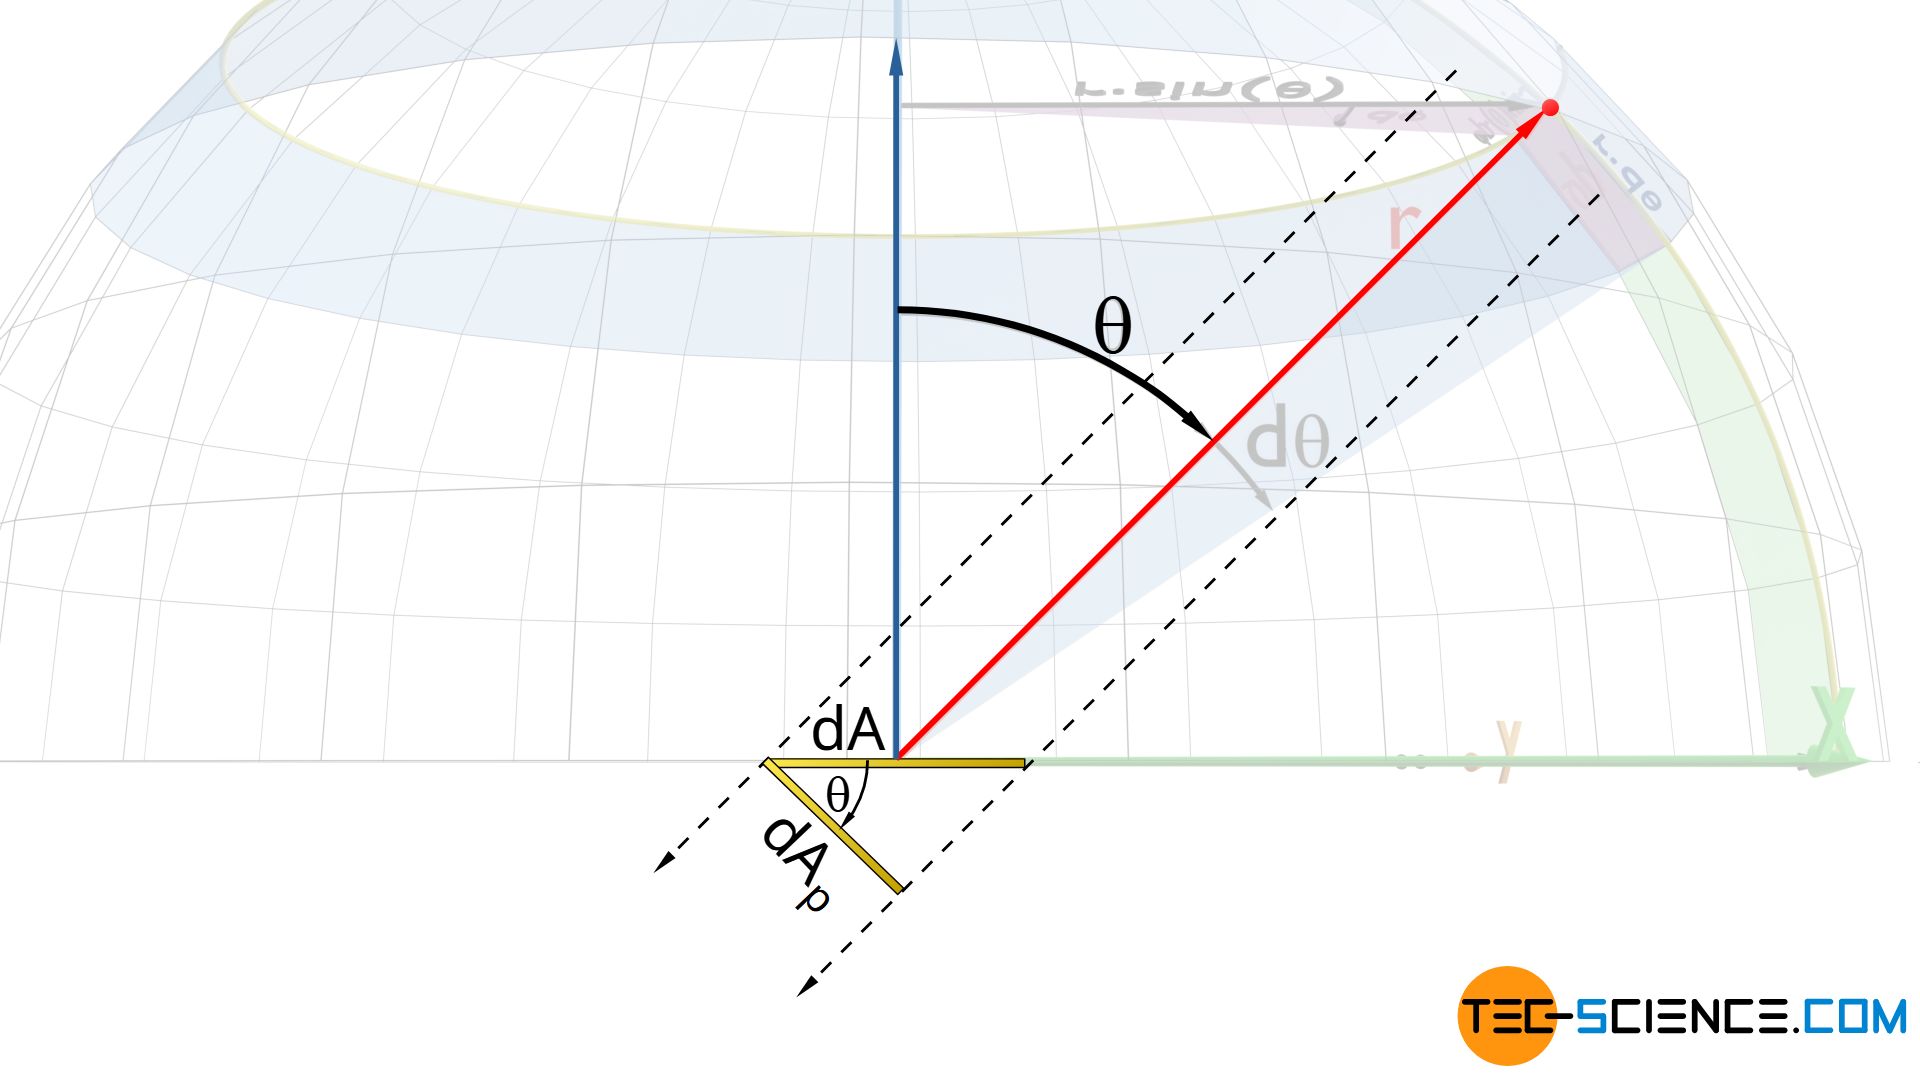
First of all, a solid angle dΩ must be assigned a direction so that the projected area dAp can be determined. For this purpose a segment of a surface dσ required for the solid angle to be determined is best described by spherical coordinates. A single point on the surface of a sphere is fully defined in by specifying two angles. The angle φ is the angle in the x-y plane and the angle θ is the angle to the z axis.
If one now allows both angles to vary within a certain range dφ and dθ, the result is a spherical segment dσ. The area of this segment can be determined as follows:
\begin{align}
& \text{d}\sigma = r^2 \cdot \sin(\theta) ~ \text{d}\theta \cdot \text{d}\varphi \ \\[5px]
\end{align}
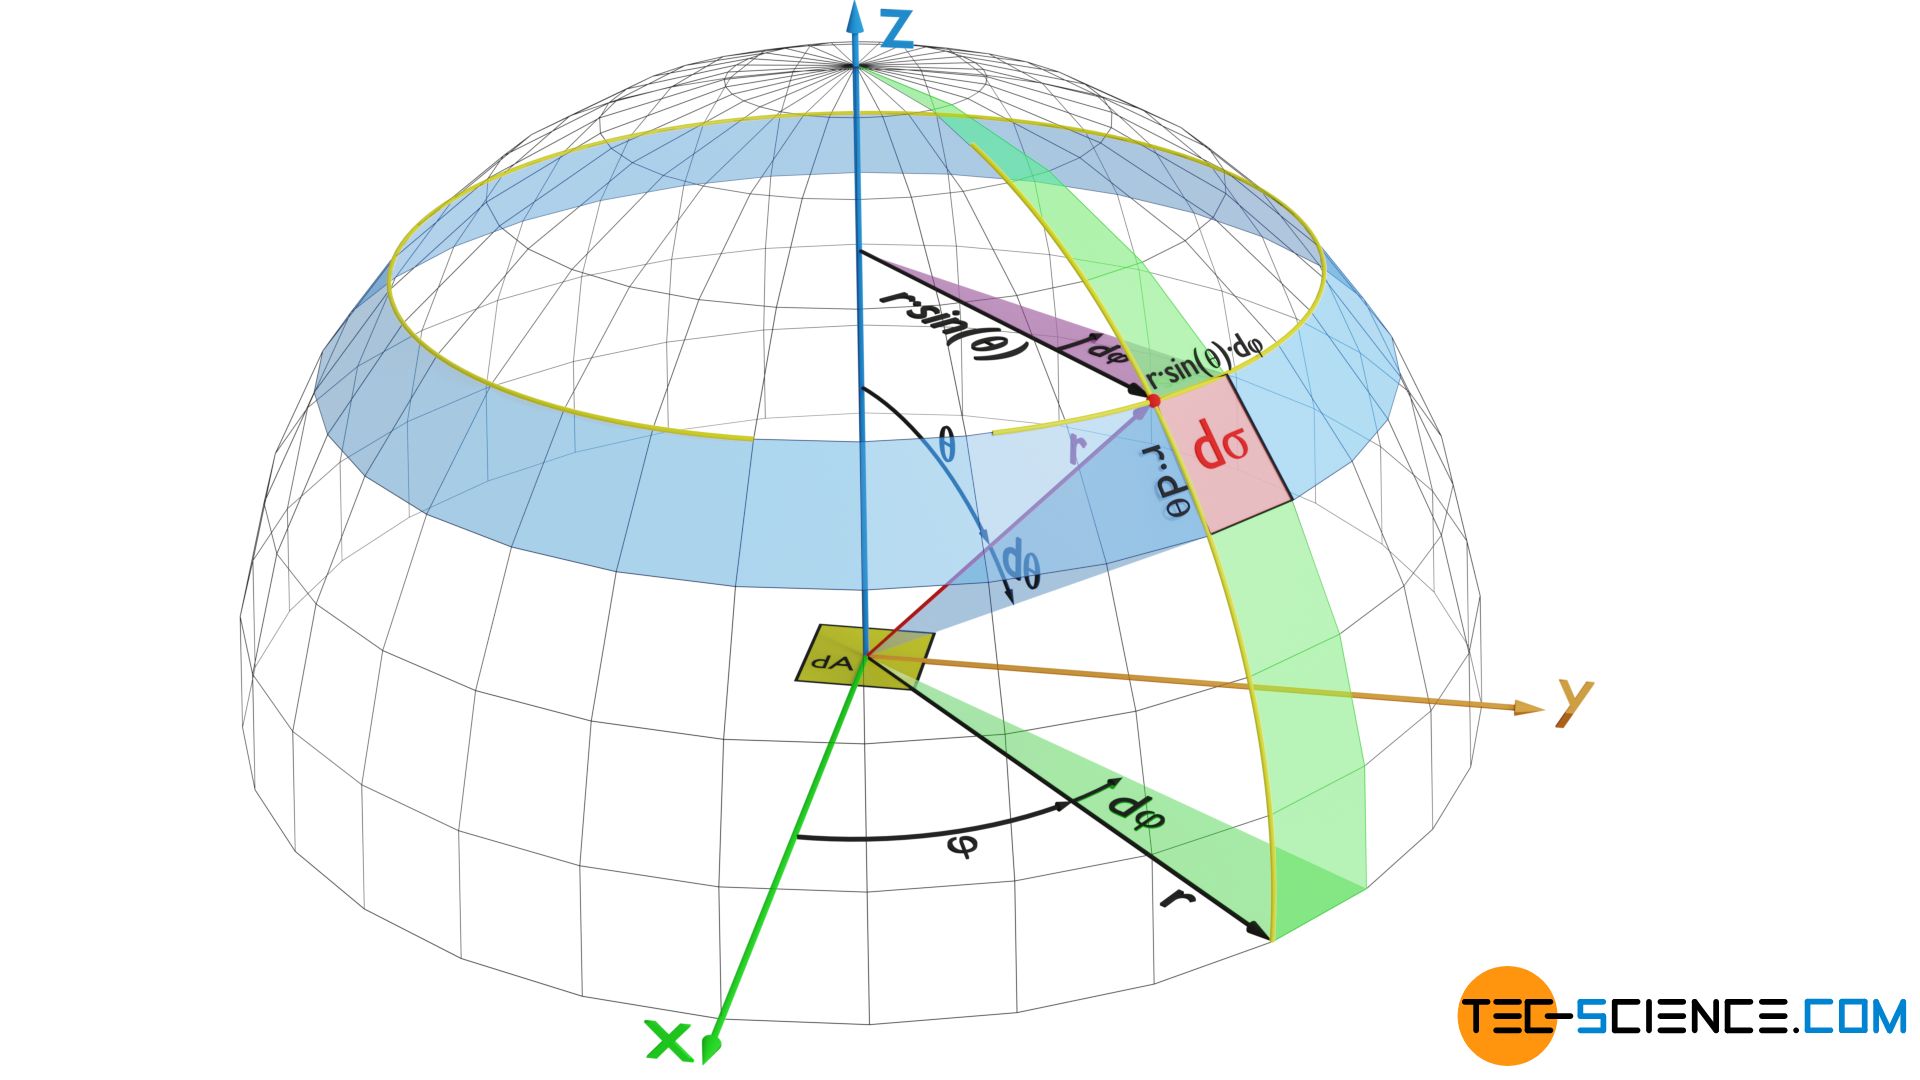
With the definition of a solid angle dΩ as the ratio of the area dσ to the square of the radius r², the solid angle is determined as follows:
\begin{align}
\label{x}
& \text{d}\Omega = \frac{\text{d}\sigma}{r^2}= \sin(\theta) ~ \text{d}\theta \cdot \text{d}\varphi \ \\[5px]
\end{align}
The area dAp projected in the direction of the position vector results from the cosine of the angle θ:
\begin{align}
\label{y}
& \text{d}A_p = \text{d}A \cdot \cos(\theta) \ \\[5px]
\end{align}
If the equations (\ref{x}) and (\ref{y}) are used in equation (\ref{l}), then the following relationship results:
\begin{align}
\require{cancel}
I_s \cdot \text{d}A &= \int \limits_{(A)} B_s \cdot \text{d}A_p \cdot \text{d}\Omega \\[5px]
I_s \cdot \bcancel{\text{d}A} &= \int \limits_{(A)} B_s \cdot \bcancel{\text{d}A} \cdot \underbrace{\cos(\theta) \cdot \sin(\theta)}_{=\tfrac{1}{2}\cdot \sin(2\theta)} ~ \text{d}\theta \cdot \text{d}\varphi \\[5px]
I_s &= B_s \cdot \tfrac{1}{2} \int \limits_{(A)} \sin(2\theta) ~ \text{d}\theta \cdot \text{d}\varphi \\[5px]
\end{align}
Note that, as explained above, Bs is constant everywhere on the surface of the sphere, and therefore is a constant quantity when integrating. Only the integration over the hemisphere has to be done, i.e. within the limits of φ=0…2π and θ=0…π/2:
\begin{align}
I_s &= B_s \cdot \tfrac{1}{2} \int \limits_{\varphi=0}^{2\pi} \int \limits_{\theta=0}^{\tfrac{\pi}{2}} \sin(2\theta) ~ \text{d}\theta \cdot \text{d}\varphi \\[5px]
&= B_s \cdot \tfrac{1}{2} \int \limits_{\varphi=0}^{2\pi} \underbrace{\left[ -\frac{1}{2} \cos(2\theta) \right]_{\theta=0}^{\tfrac{\pi}{2}}}_{=1} \text{d}\varphi \\[5px]
&= B_s \cdot \tfrac{1}{2} \cdot \int \limits_{\varphi=0}^{2\pi} \text{d}\varphi \\[5px]
&= B_s\cdot \tfrac{1}{2} \cdot \left[\varphi \right]_{\varphi=0}^{2\pi} \\[5px]
&= B_s\cdot \tfrac{1}{2} \cdot 2\pi \\[5px]
&= B_s \cdot \pi \\[5px]
\end{align}
Spectral intensity Is and spectral flux Bs differ only by the factor π. This applies to both the wavelength form and the frequency form:
\begin{align}
\label{gg}
\boxed{I_s = B_s \cdot \pi} \\[5px]
\end{align}
Distribution of the spectral energy density of cavity radiation
The spectral flux makes it possible to draw conclusions about the so-called spectral energy density us of cavity radiation. Spectral energy density means the radiant energy contained in the volume of the cavity per unit wavelength interval.
For this we again look at a hollow object with a tiny hole. All radiation coming in through the opening is absorbed by the inner walls with every reflection until after a few reflections all radiation is absorbed. The hole is by definition a blackbody that absorbs all incident radiation. However, depending on the temperature of the cavity, the inner walls themselves emit radiation. In thermodynamic equilibrium, the walls absorb as much radiant energy as they emit, so that neither further heating nor cooling of the cavity or body occurs.
Inside the cavity thus a kind of photon gas is formed (the Derivation of the Stefan-Boltzmann law is based exactly on this idea of photon gas). The radiant energy or energy density present in such a cavity can be determined from the blackbody radiation emitted through the opening.
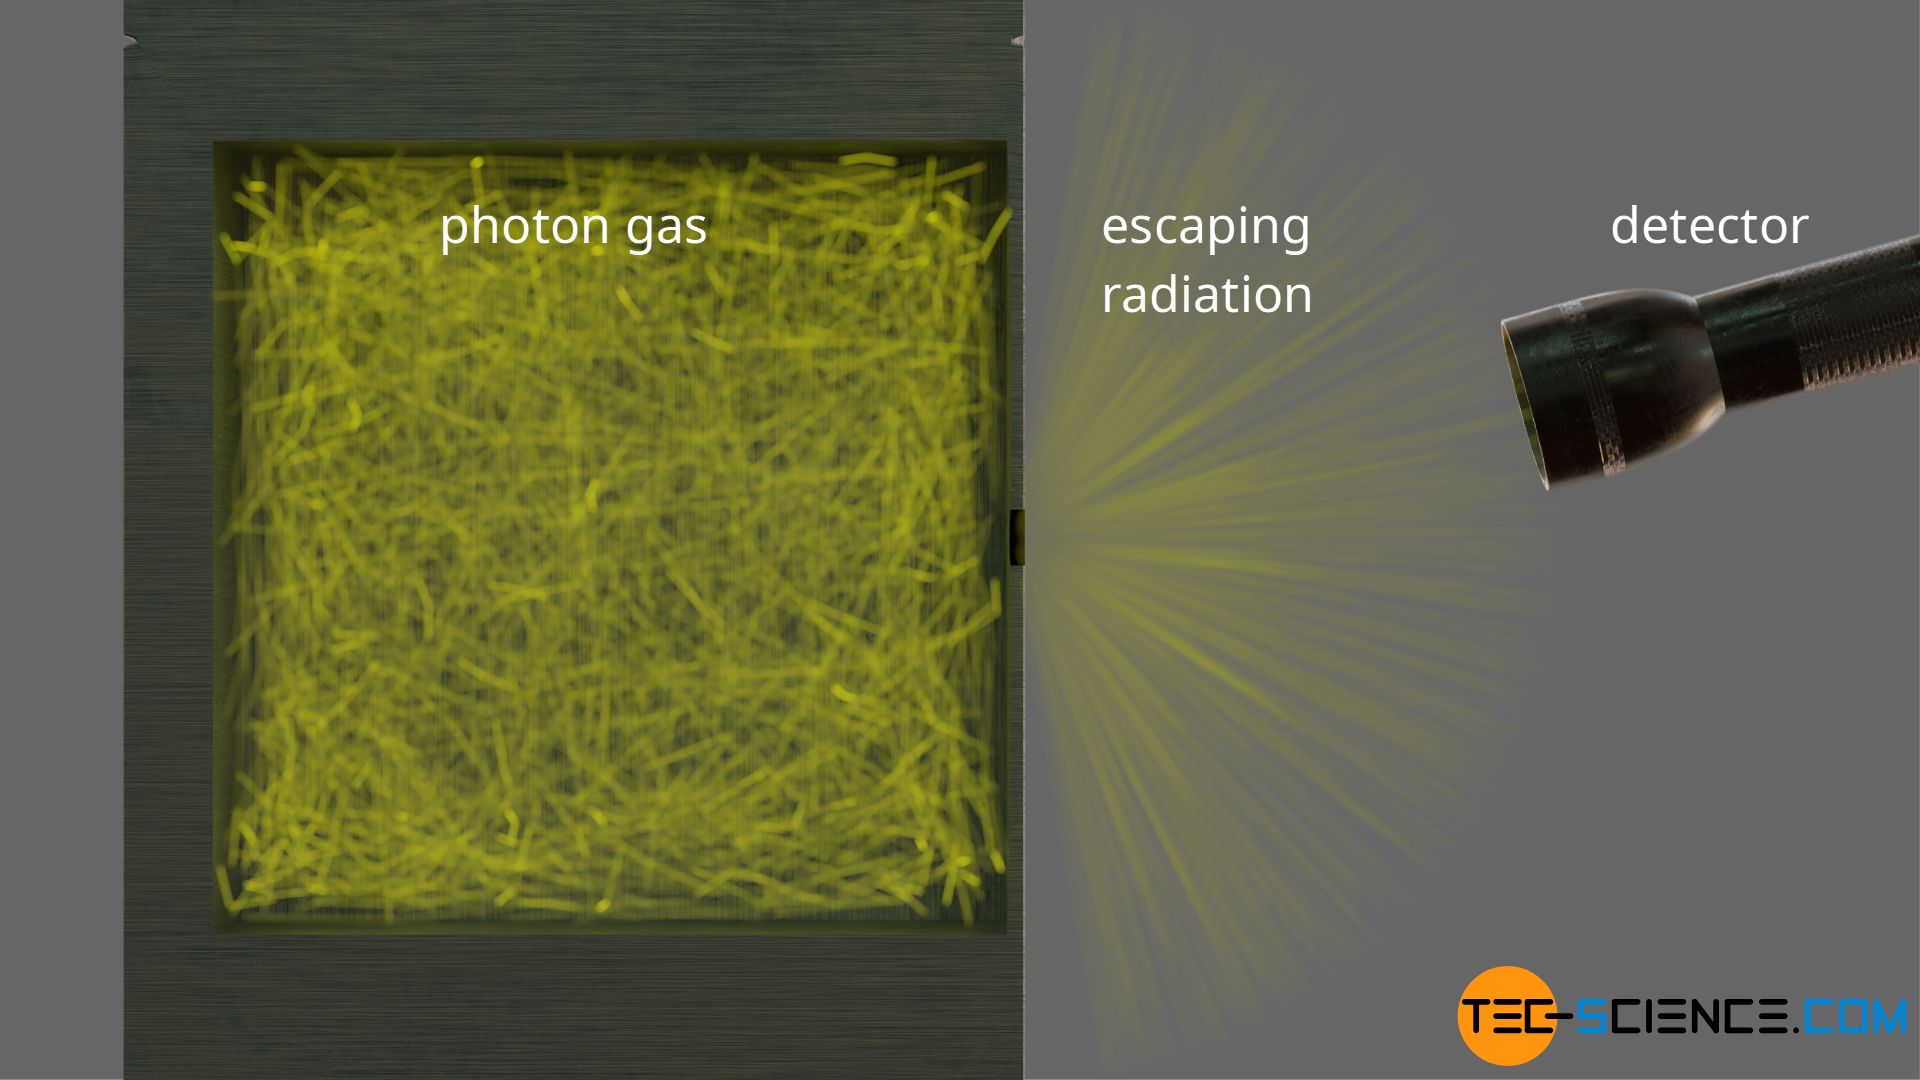
For this we consider a surface element dA at the opening to the cavity. The surface element is thus part of the photon gas. As usual with gases, the photons in the photon gas move in different directions. Half of the radiation thus escapes into free space, where it can be detected. The other half of the photons moves back into the cavity.
At any solid angle dΩ radiation is emitted from the projected area dAp. The photons moving at the speed of light c cover the distance dl within the time dt:
\begin{align}
&\text{d}l = c \cdot \text{d}t \\[5px]
\end{align}
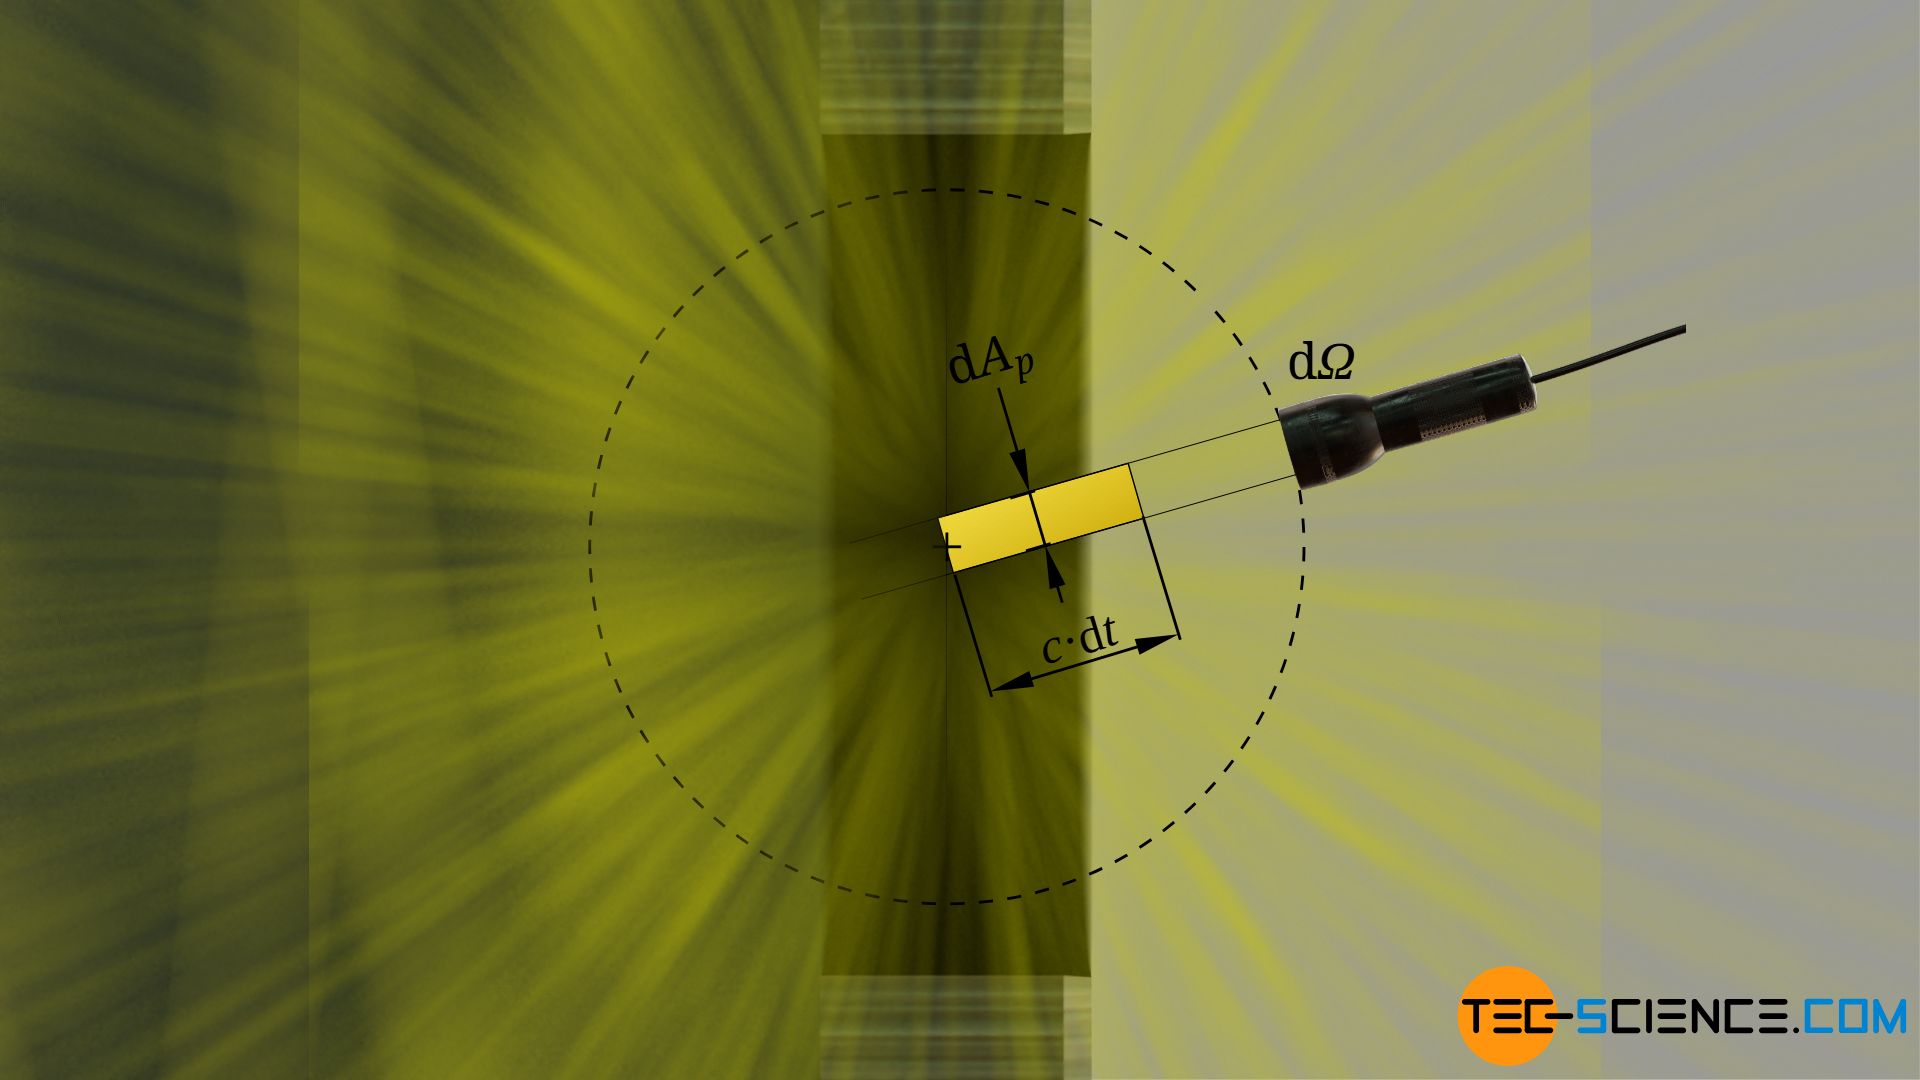
Within the time dt the photons thus occupy the following volume dV:
\begin{align}
&\text{d}V = \text{d}A_p \cdot \text{d}l = \text{d}A_p \cdot c \cdot \text{d}t \\[5px]
\end{align}
The radiant energy dU in the wavelength interval dλ, which is contained in the emitted radiation, can be determined by the spectral flux Bs and the time interval dt [see equation (\ref{p})].
\begin{align}
\require{cancel}
&\text{d}U = \overbrace{B_s \cdot \text{d}A_p \cdot \text{d}\lambda \cdot \text{d}\Omega}^{\text{d}P} \cdot \text{d}t \\[5px]
\end{align}
For the energy density u as the ratio of energy dU and volume dV the following formula applies:
\begin{align}
\require{cancel}
&u = \frac{\text{d}U}{\text{d}V} = \frac{B_s \cdot \cancel{\text{d}A_p} \cdot \text{d}\lambda \cdot \text{d}\Omega \cdot \cancel{\text{d}t}}{ \cancel{\text{d}A_p} \cdot c \cdot \cancel{\text{d}t} } \\[5px]
&u = \frac{\text{d}U}{\text{d}V} = \frac{B_s \cdot \text{d}\lambda \cdot \text{d}\Omega}{c} \\[5px]
\end{align}
The energy density in this form still depends on the wavelength interval and the solid angle. Therefore, the energy density is usually expressed as spectral energy density us, i.e. as energy density per unit wavelength interval. Furthermore, in the case of a volume element, it makes no sense to relate the energy density to a solid angle. After all, the entire volume element is considered with its energy density. Therefore the energy density must be related to the “entire volume”, i.e. to a full sphere with a solid angle of dΩ=4π:
\begin{align}
&u_s = \frac{u}{\text{d}\lambda} = \frac{B_s}{c} \cdot \text{d}\Omega = \frac{B_s}{c} \cdot 4\pi \\[5px]
&\boxed{u_s = \frac{4\pi}{c} \cdot B_s} \\[5px]
\end{align}
Finally, the following relationship exists between the spectral energy density and the spectral intensity [see equation (\ref{gg})]:
\begin{align}
&\boxed{u_s = \frac{4}{c} \cdot I_s} \\[5px]
\end{align}
This relationship between the spectral energy density and the (specific) spectral intensity applies not only to the wavelength form but also to the frequency form. In this case the spectral energy density then means the energy density per unit frequency interval.
\begin{align}
&\boxed{u_s(\lambda) = \frac{8 \pi h c}{\lambda^5} \cdot \frac{1}{\exp\left(\dfrac{h c}{\lambda k_B T}\right)-1} } ~~~\text{wavelength form} \\[5px]
\end{align}
\begin{align}
&\boxed{u_s(f) = \frac{8 \pi h f^3}{c^3} \cdot \frac{1}{\exp\left(\dfrac{h f}{k_B T}\right)-1} } ~~~\text{frequency form} \\[5px]
\end{align}
The total energy density inside the cavity of a black body would finally be obtained by integrating these equations over the entire wavelength or frequency range from zero to infinity. This total energy density is only dependent on temperature and is spatially constant throughout the cavity. If the energy density would differ in two points, then more energy would be contained in one volume element than in the other. The volume element with the higher energy density would radiate “more” than the other. However, the photon gas or the entire cavity would then not be in thermodynamic equilibrium.
Furthermore, the energy density is not dependent on the volume of the cavity. The spectral distribution of the energy density is solely determined by the temperature. So whether the cavity is small or large is irrelevant for the (spectral) energy density contained in it!
The energy density inside the cavity of a hollow black body depends only on the temperature!

?")
")


