In the compression test, a standardized specimen is loaded under compressive stress until it breaks or until a first crack appears.
The testing of materials under compressive stress is carried out in the so-called compression test. Standardized round specimens are used, which are much thicker than tensile specimens. The maximum height of the sample is twice the diameter to prevent the sample from buckling during the test. For testing, the specimen is clamped between two pressure plates and compressed under increasing force. The compression test is carried out for brittle specimens up to fracture and for ductile materials up to the appearance of a first crack.
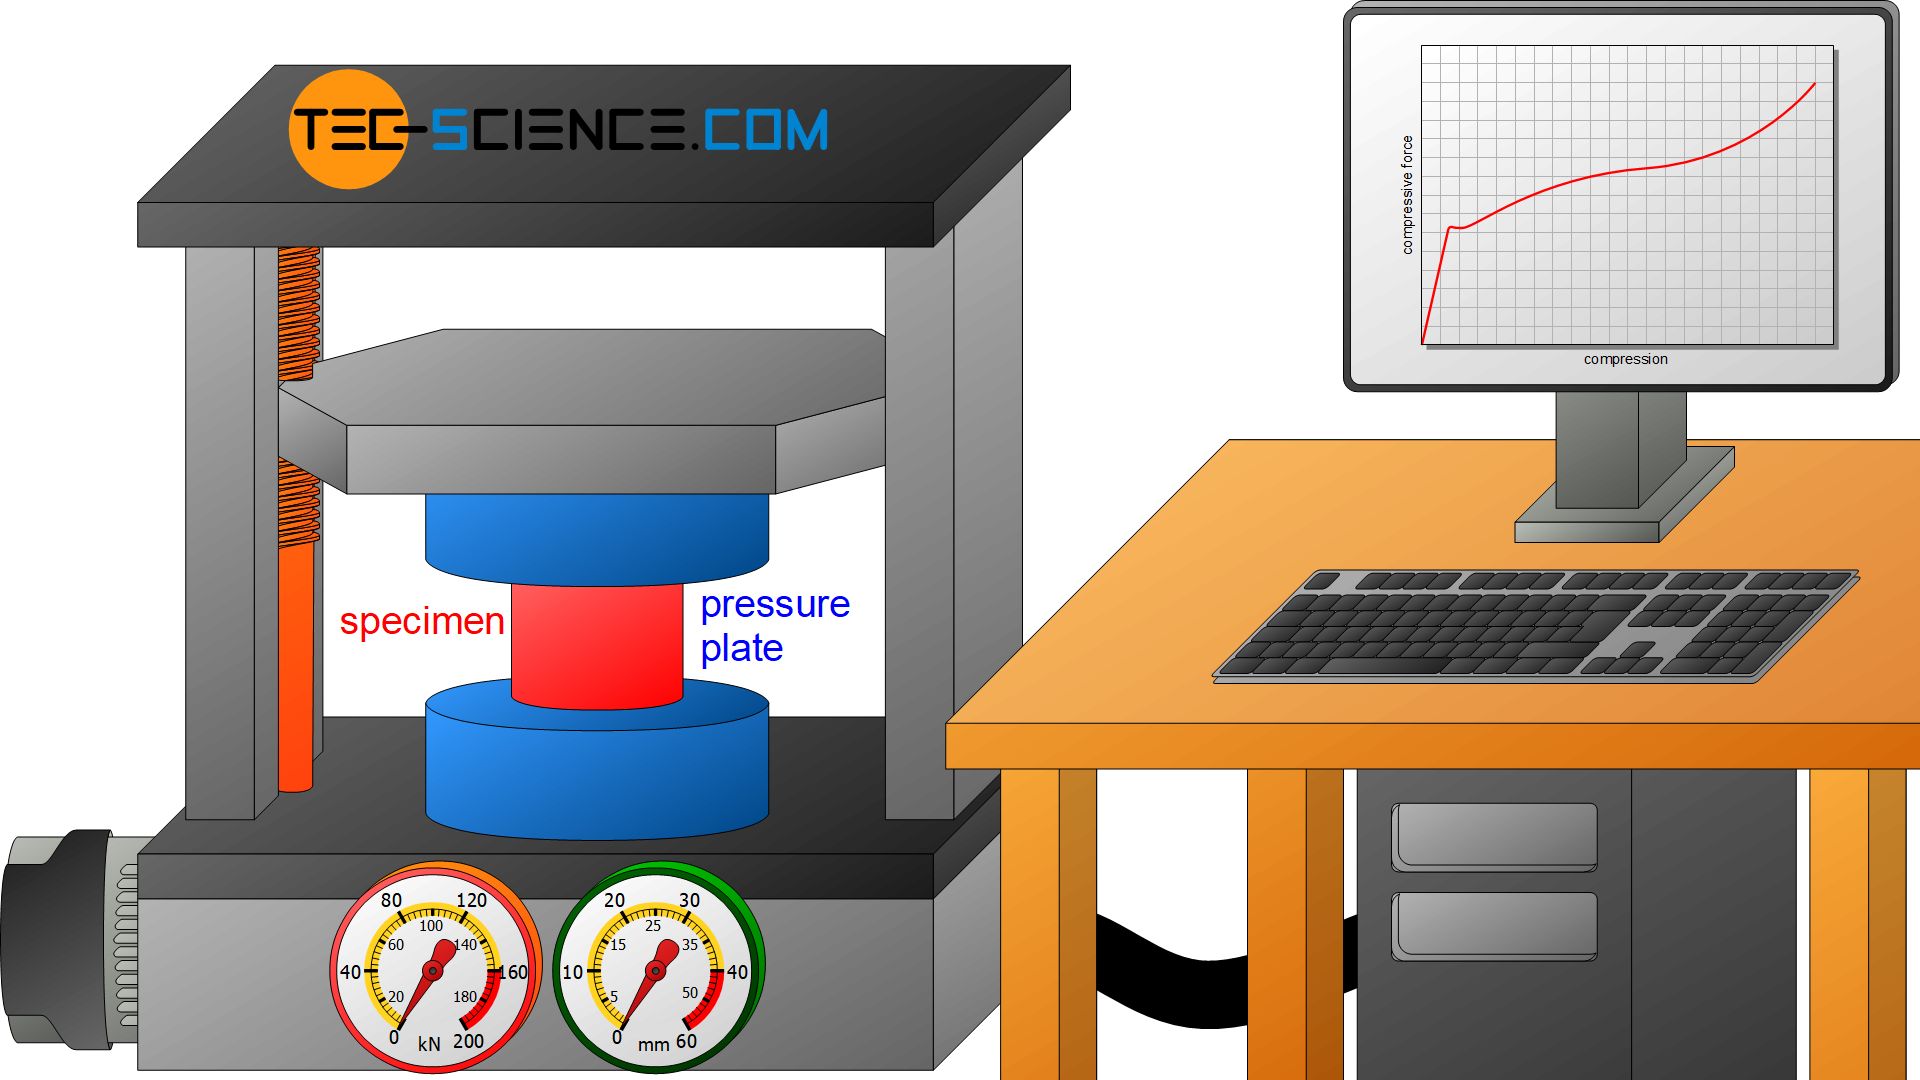
In the compression test, a standardized specimen is loaded under compressive stress until it breaks or until a first crack appears. The force is recorded as a function of the specimen compression!
The curve recorded during the test (geometry-dependent) is then converted into a geometry-independent compressive stress diagram. To determine the engineering compressive stress \(\sigma_c\), the compressive force \(F_c\) is always referred to the initial cross-sectional area \(S_0\) analogous to the tensile stress and irrespective of the actual cross-sectional area:
\begin{align}
\label{technische_druckspannung}
&\boxed{\sigma_c = \frac{F_c}{S_0}}~~~~~[\sigma]=\frac{\text{N}}{\text{mm²}} &&\text{engineering compressive stress} \\[5px]
\end{align}
The specimen compression \(\epsilon_c\) is obtained in the analogous way to the tensile strain by referring the shortening of the specimen \(\Delta h\) to the initial height \(h_0\) (usually given as a percentage):
\begin{align}
\label{stauchung}
&\boxed{\epsilon_c= \frac{\Delta h}{h_0} \cdot 100 \text{%}}~~~~~[\epsilon_d]=\text{%} ~~~~~\text{compression} \\[5px]
\end{align}
The stress-compression diagram below shows the typical curve of a brittle specimen (cast iron) and a ductile specimen (steel) as well as the stress curve of a ductile specimen with low strength (zinc). At this point it must be noted again that the compressive stress is always determined on the basis of the initial cross-sectional area and not the actual cross-section.
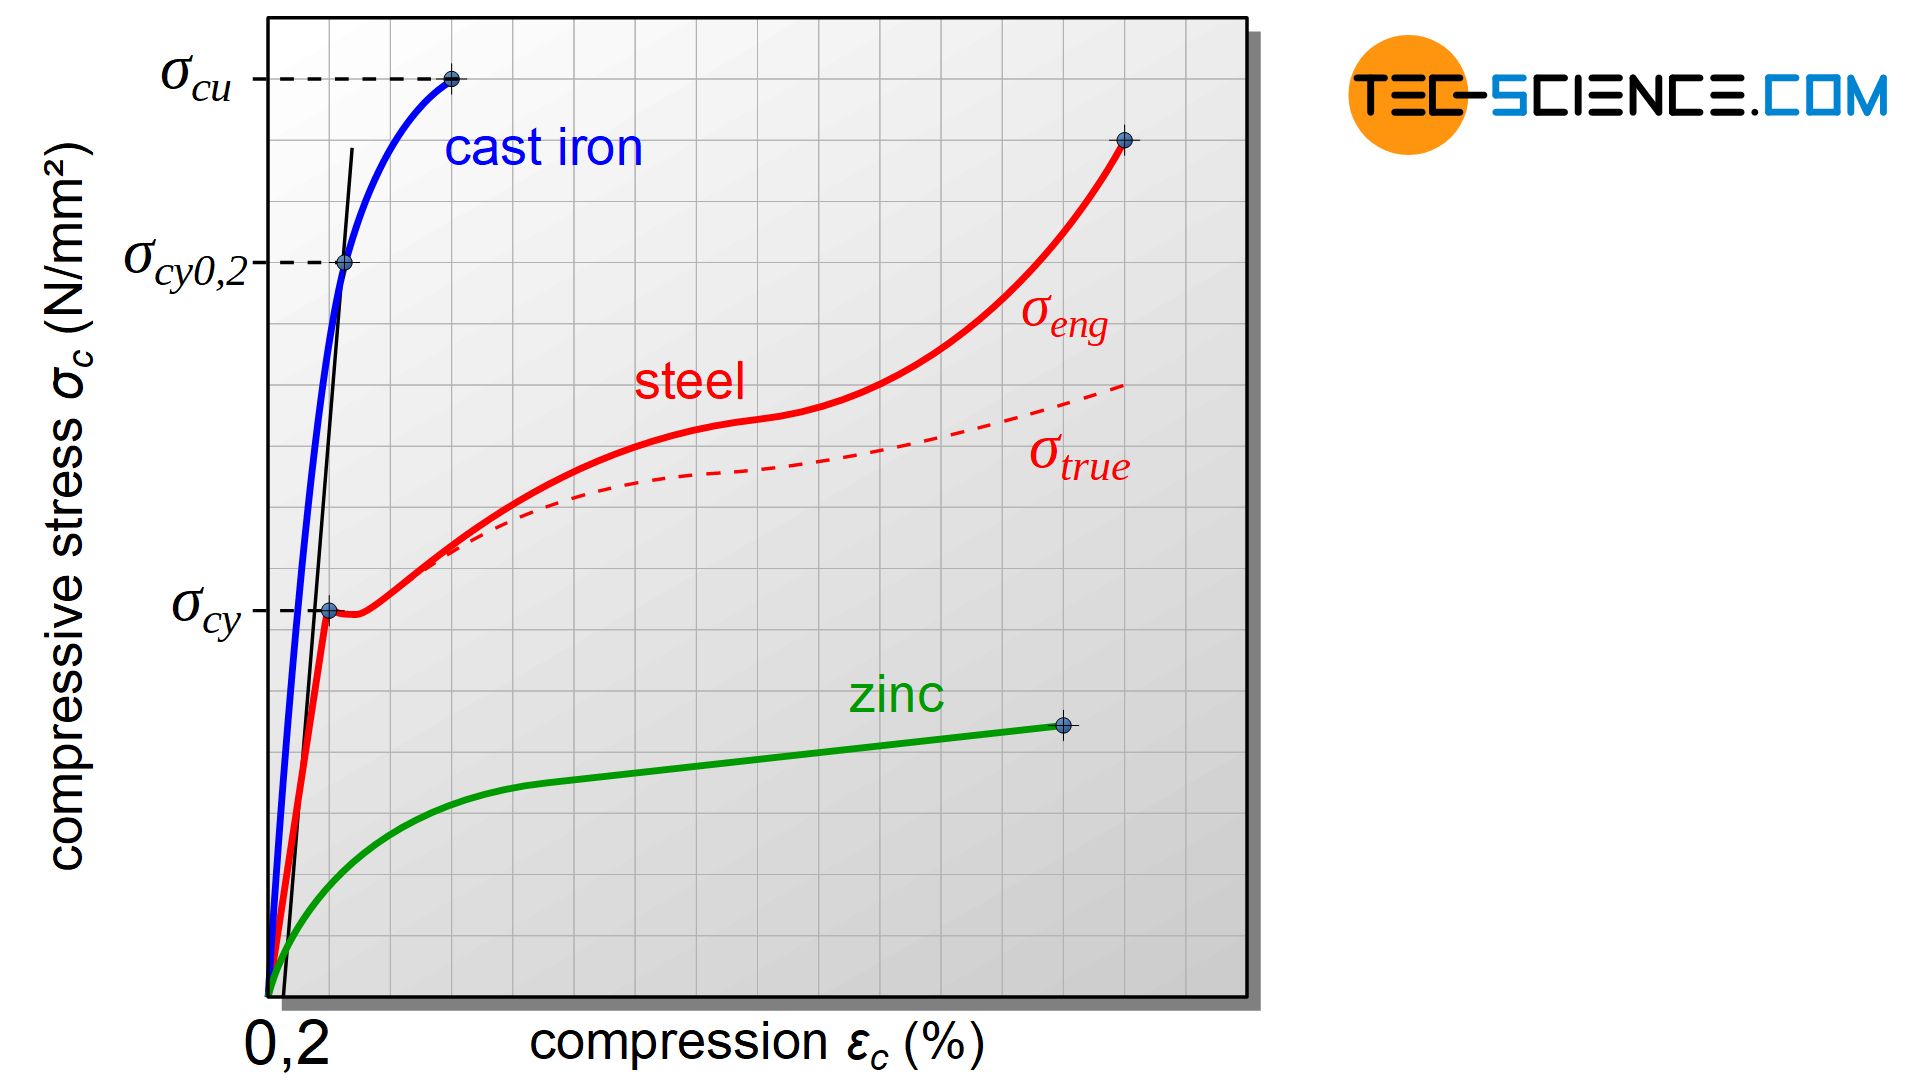
Due to bulging effects during the test, the cross-sectional area increases and the true compressive stress inside is lower than the engineering compressive stress. The true compressive stress curve therefore runs below the engineering stress curve.
According to the compressive stress-strain curve, the material behavior under pressure can be divided into different regions. If a compression test is subjected to relatively little pressure, the deformation will completely decrease after the stress has been removed. This elastic region can be seen in the diagram on the basis of the almost straight line.
At high stress, however, the elastic limit is exceeded and permanent deformation is maintained even after the force is removed (plastic region). For some materials, this limit can be seen very clearly in the diagram by the discontinuous transition from a straight line to a curve.
The stress limit at which a specimen is just about squeezed without plastic deformation in a compression test is also referred to as the compressive yield strength \(\sigma_{cy}\) (compressive flow limit). The compressive yield point is to be regarded as an analogy to the yield point for tensile loading.
The maximum bearable compressive stress without permanent deformation of the material is referred to as compressive yield strength (elastic limit)!
A prerequisite for determining the yield point is that a clear straight line can be found in the diagram with a correspondingly discontinuous transition into the plastic range (e.g. given for many steels). However, some materials do not show a straight line in the diagram but a continuous transition into the plastic region (e.g. grey cast iron). For these materials, the corresponding compression limits are given in analogy to the offset yield strengths for tensile loading. In this case the limit is called compressive offset yield strength. The 0.2 % limit is also particularly important here. This 0.2 % compressive offset yield strength \(\sigma_{c0.2}\) is to be interpreted as the stress at which a compression of 0.2 % remains permanently after the sample has been relieved.
In the case of materials which do not have a pronounced compressive yield strength, a corresponding offset yield strength is given as a replacement, which indicates the compressive stress at a fixed permanent compression!
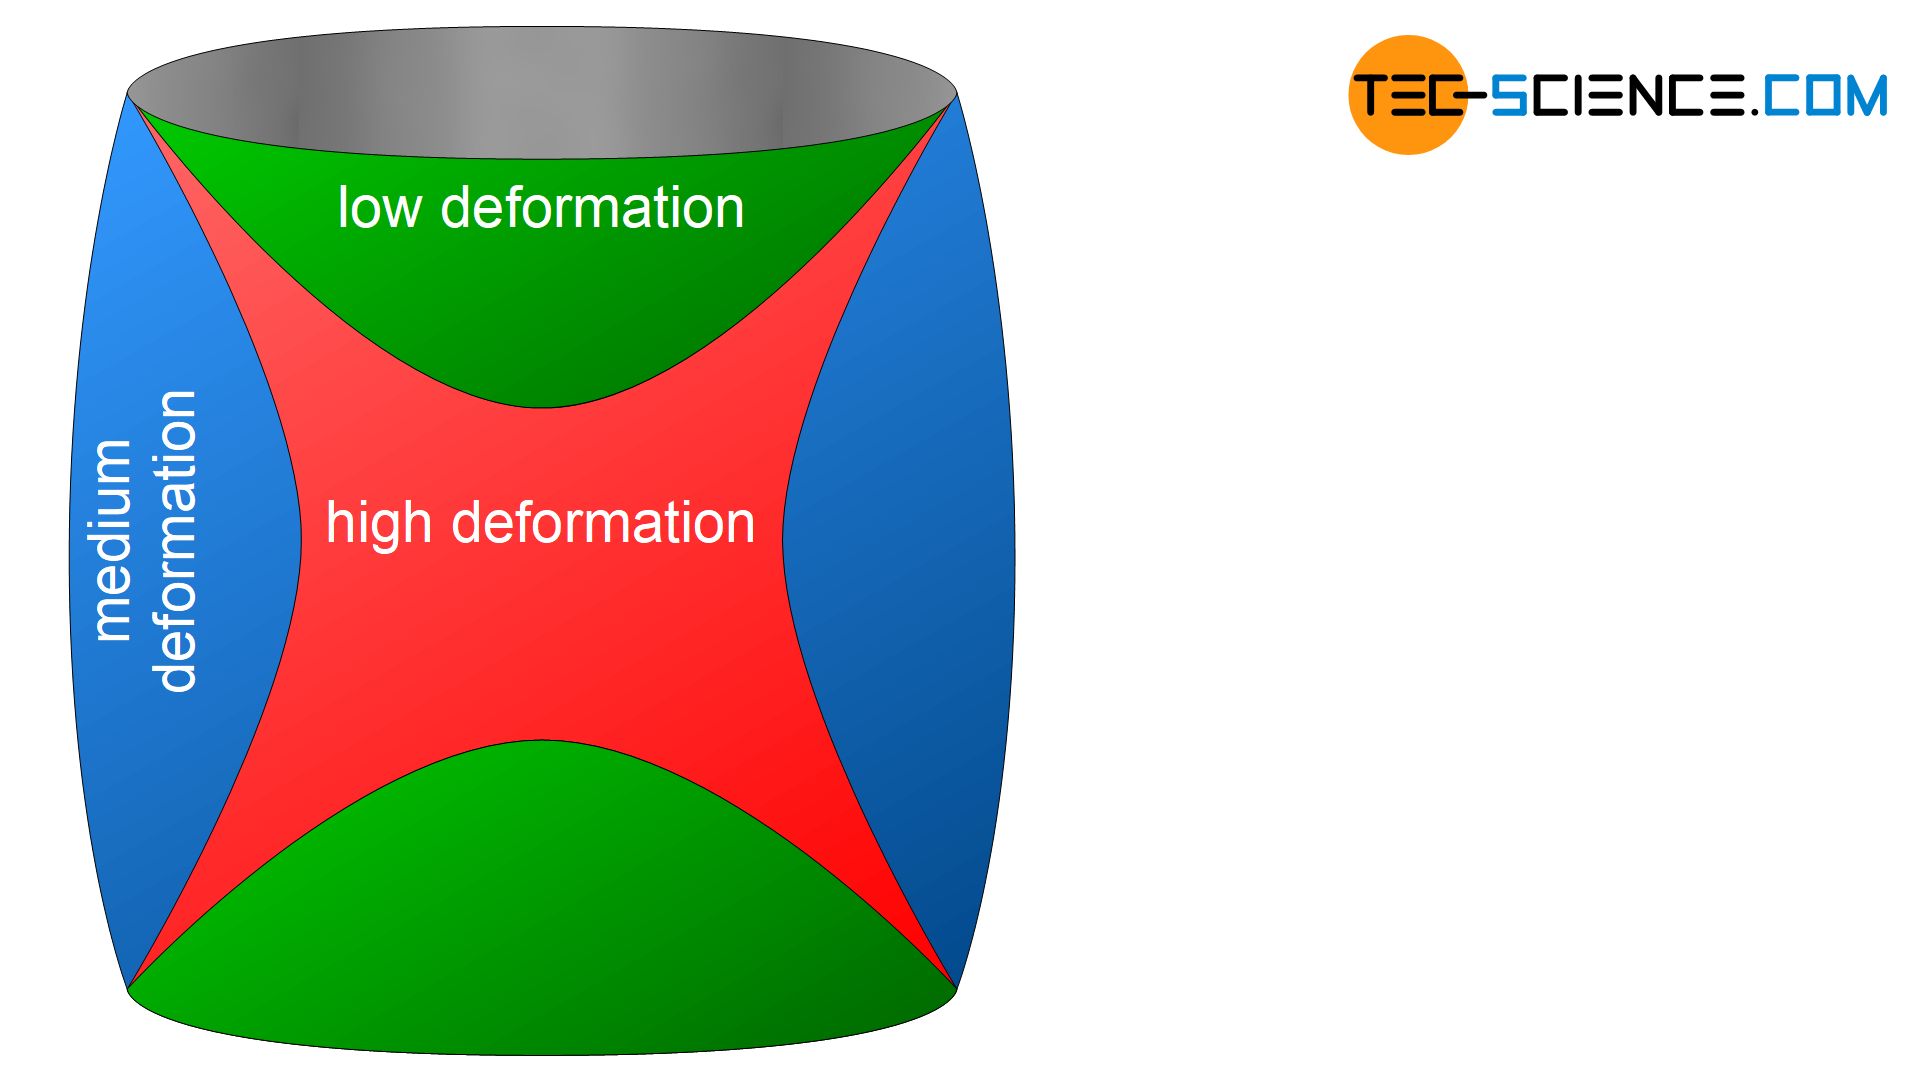
Due to the high frictional forces between the upper side of the specimen and the pressure plate or between the underside of the specimen and the base, the compression is not uniform over the specimen height. Rather, the specimen sticks to the contact point and does not allow any deformation there, while the middle part of the specimen can flow away to the side. Depending on the ductility of the sample, a more or less pronounced bulging occurs during the compression test.
In contrast to the tensile test in which a uniform strain exists, there is no analog counterpart in the compression test, such as a uniform compression! The zone of inhibining deformation by friction decreases starting from the base areas of the specimen towards the center of the specimen. Conical zones where deformation is hindered form inside the material (referred to as pressure cones) .
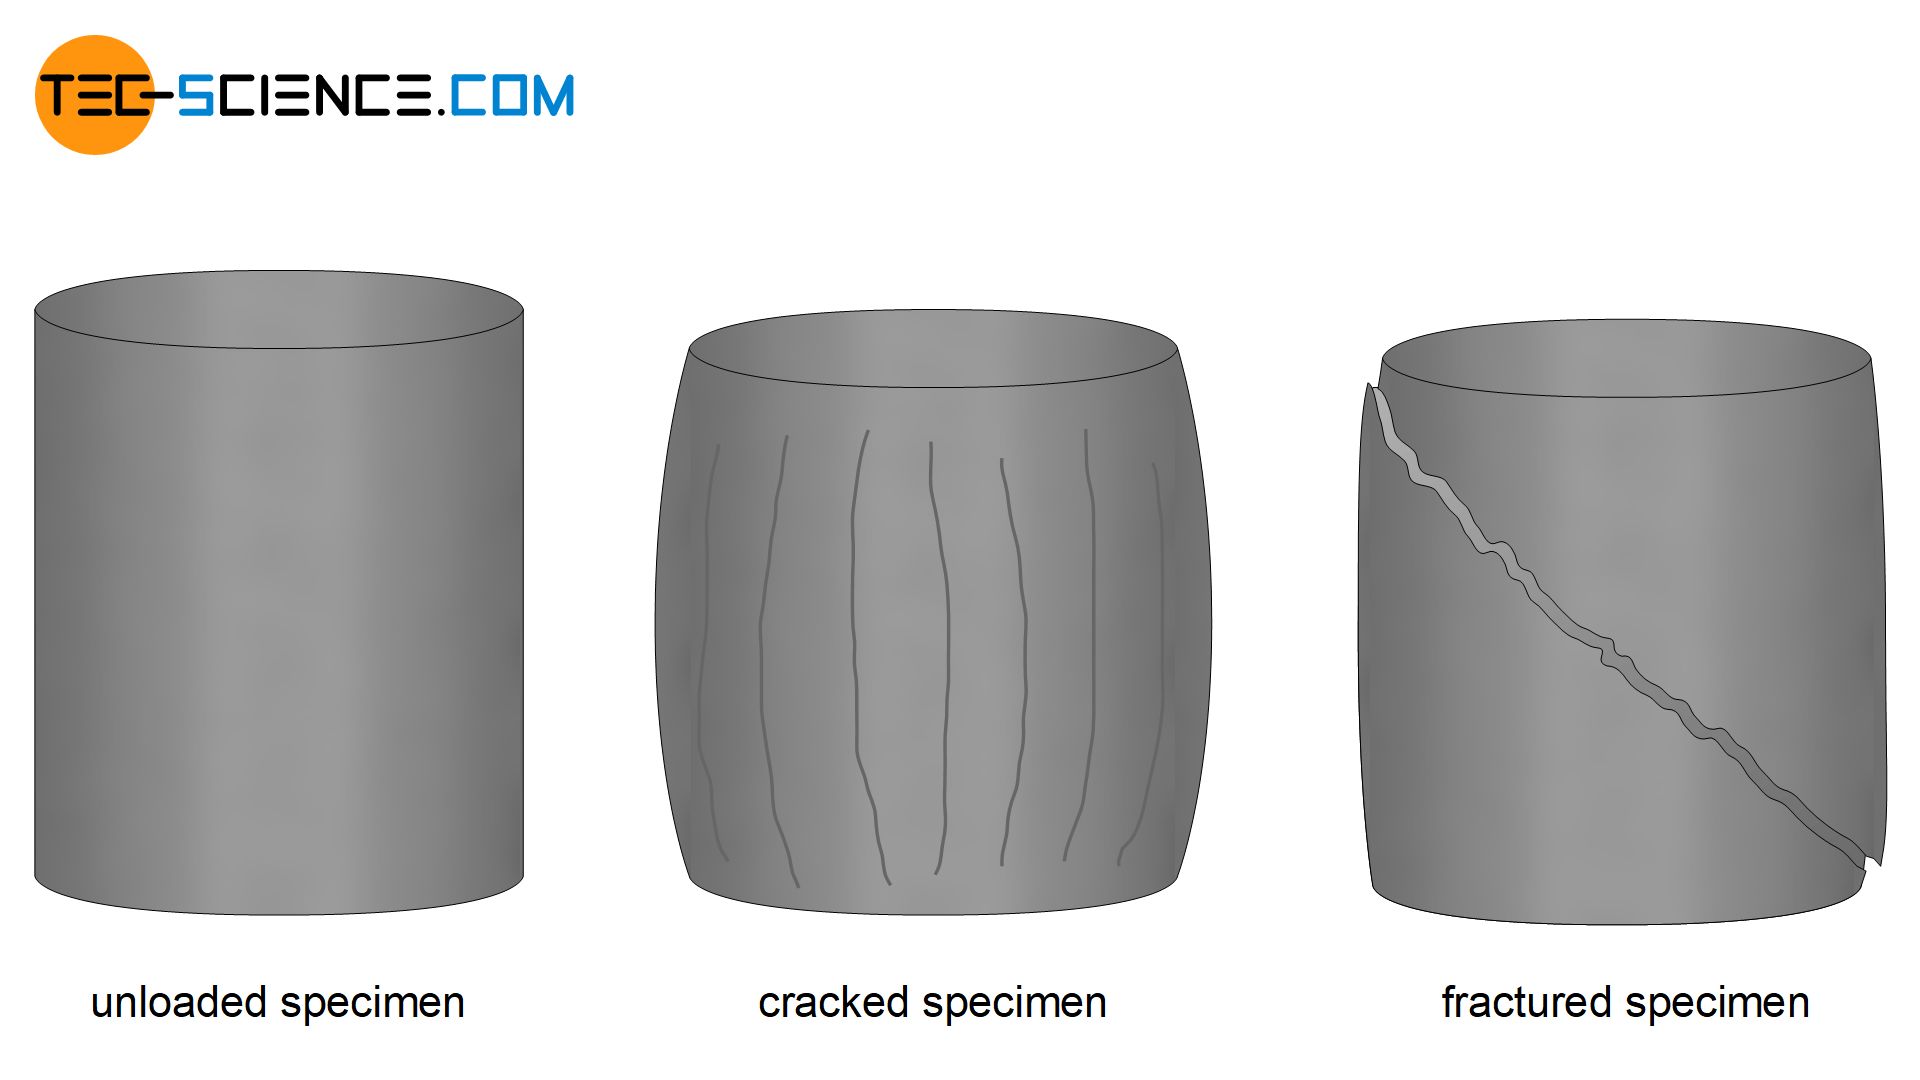
Due to the bulging of the specimen, the skin surface of the specimen are strongly stretched and tensile stress occurs. These can become so large that the material tears along the direction of loading. The resulting crack is often used as a failure criterion for ductile materials.
In the case of brittle materials, the almost undeformed pressure cones slide like wedges into the surrounding material and provide very high shear stresses in the central part of the specimen. Since the greatest shear stresses occur at an angle of 45° to the direction of compressive stress, brittle specimens usually fracture along this direction.
The onset of a crack in ductile materials or the sudden break in brittle specimens is characterized by the so-called (ultimate) compressive strength \(\sigma_{cu}\). This strength parameter is to be considered in analogy to the ultimate tensile strength for tensile loading.
The compressive strength indicates the maximum bearable compressive stress at fracture!
In addition, the compression test can be used to determine the permanent compression after fracture, the so-called fracture compression or also called compression at break \(A_{c}\). This deformation parameter corresponds to the fracture strain (elongation at break) for tensile loading. Furthermore, in analogy to the reduction in area \(Z\) of a tensile specimen, the increase in area \(\Psi\) of a compressive specimen can be determined. This parameter ist defined as the ratio of cross-sectional change after fracture to initial cross section of the specimen.
In summary, a tabular comparison of the characteristic values of the tensile test and the compression test is given:
| parameter | tensile test | compression test |
| nominal stress | tensile stress \(\sigma\) | compressive stress \(\sigma_{c}\) |
| relative change in length | strain \(\epsilon\) | compression \(\epsilon_{c}\) |
| flow limit | yield strength \(\sigma_y\) | compressive yield strength \(\sigma_{cy}\) |
| alternative limits | 0,2 % offset yield strength \(\sigma_{y0,2}\) | 0,2% compressive offset yield strength \(\sigma_{cy0,2}\) |
| failure parameter | tensile strength \(\sigma_u\) | compressive strength \(\sigma_{cu}\) |
| relative permanent change in length | fracture strain \(A\) (elongation at break) | fracture compression \(A_c\) (compression at break) |
| relative permanent cross-sectional change | reduction in area \(Z\) | increase in area \(\Psi\) |


")
")
")