The Moody diagram is a chart showing the Darcy friction factor of a pipe as a function of the Reynolds number for selected roughnesses of the pipe wall.
Pressure loss
In the article about the Darcy friction factor the pressure loss in pipes and the associated formulas have already been discussed in detail. Therefore, in this article the formulas are only briefly summarized. The pressure loss Δpl along a pipe with the inside diameter d and the length L depends on the fluid density ϱ and the (mean) flow velocity v:
\begin{align}
\label{def}
& \boxed{\Delta p_\text{l} = f\cdot \frac{\rho}{2} \bar v^2 \cdot \frac{L}{ d}} ~~~\text{pressure loss in a straight pipe section} \\[5px]
\end{align}

The influence of the flow type (laminar or turbulent) and roughness of the pipe wall on the pressure loss are taken into account by the so-called Darcy friction factor f (also referred to as resistance coefficient or just friction factor).
The pressure loss can also be expressed as a function of the volume flow rate V*:
\begin{align}
\label{volu}
& \boxed{\Delta p_\text{l} = f \cdot \frac{8\rho~}{\pi^2} \dot{V}^2 \cdot \frac{L}{d^5}} ~~~\text{pressure loss in a straight pipe section} \\[5px]
\end{align}
Friction factor for laminar pipe flows
For laminar flows, the friction factor is not dependent on the roughness of the pipe wall, but is only determined by the Reynolds number Re:
\begin{align}
\label{a}
&\boxed{f_\text{lam}= \dfrac{64}{Re}} ~~~\text{friction factor for laminar flows}\\[5px]
&Re= \frac{v \cdot d \cdot \rho}{\eta}
\end{align}
Friction factor for turbulent pipe flows
In turbulent flows, however, the influence of the roughness of the pipe wall is relatively large. The friction factor increases with increasing roughness and decreases with increasing flow velocity. If the Reynolds numbers are sufficiently high, the friction factor becomes independent of the flow velocity and is thus only dependent on the roughness of the pipe. The friction factor for turbulent flow is given by the Colebrook-White equation (\ref{cw}):
\begin{align}
\label{cw}
&\boxed{\color{red}{\frac{1}{\sqrt{f_\text{tur}}}}=-2\cdot \log_\text{10}\left(\frac{2.51}{Re} \cdot \color{red}{\frac{1}{\sqrt{f_\text{tur}}}} +\frac{\varepsilon}{3.71}\right)} ~~~\text{Colebrook-White equation} \\[5px]
\end{align}
In this equation ε denotes the relative roughness of the pipe wall, i.e. the ratio of surface roughness to pipe diameter.
As a simple approximation for the calculation of the friction factor, the Haaland equation given below can be used. It is also used to determine the starting value for the iterative solution of the Colebrook-White equation. For more information about the iterative solution of the Colebrook-White equation, see article Pressure loss in pipe systems.
\begin{align}
&\boxed{\color{red}{\frac{1}{\sqrt{f_\text{tur,0}}}}=-1.8\cdot \log_\text{10}\left(\frac{6.9}{Re} +\left(\frac{\varepsilon}{3.7}\right)^{1.11}\right)} ~~~\text{Haaland equation} \\[5px]
\end{align}
For hydraulically smooth pipes, where the viscous sublayer (laminar sublayer) completely covers the surface roughness, the relative roughness is zero (ε=0). The Colebrook-White equation for this special case is:
\begin{align}
&\boxed{\color{red}{\frac{1}{\sqrt{f_\text{tur}}}}=-2\cdot \log_\text{10}\left(\frac{2.51}{Re} \cdot \color{red}{\frac{1}{\sqrt{f_\text{tur}}}} \right)} ~~~\text{for hydraulically smooth pipes} \\[5px]
\end{align}
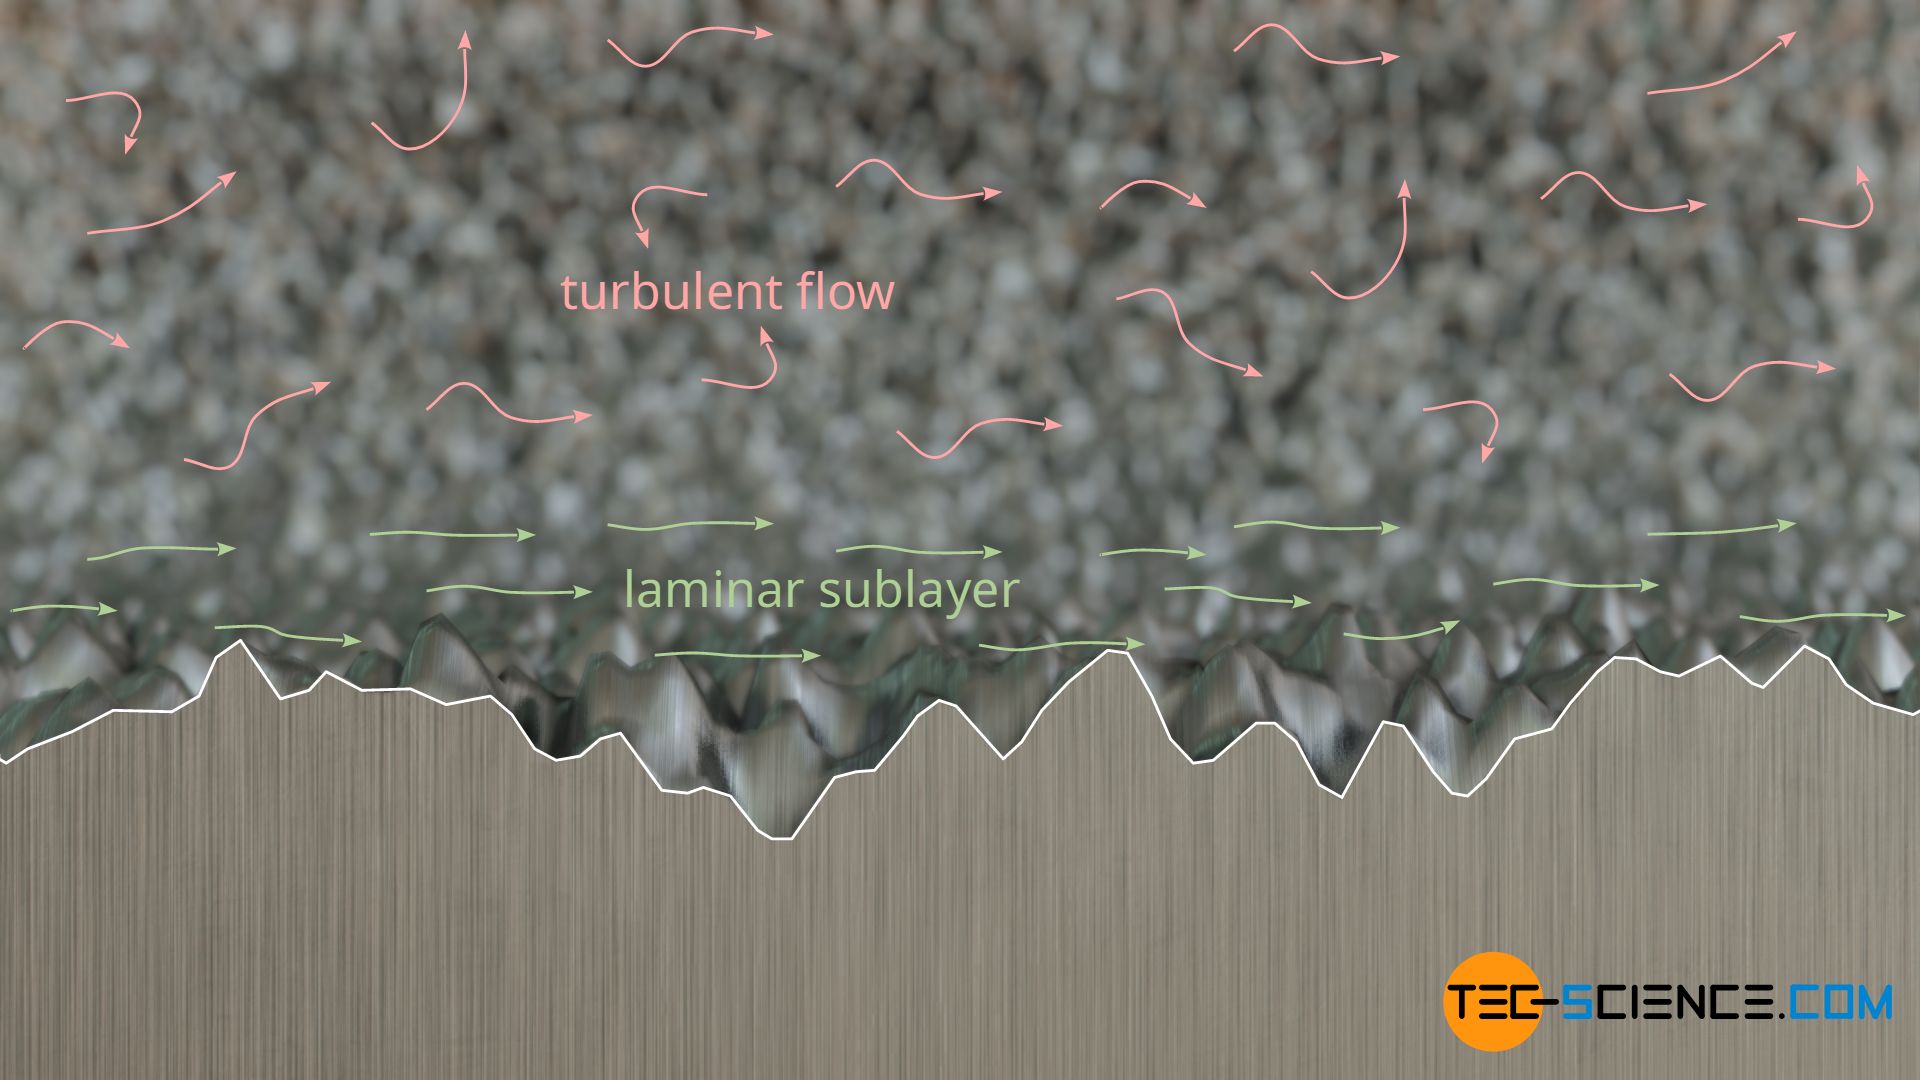
For hydraulically rough pipes, where the surface roughness protrudes completely through the viscous sublayer, the following formula by Nikuradse applies. The Darcy friction factor is no longer dependent on the Reynolds number, but is mainly determined by the wall roughness.
\begin{align}
&\boxed{\color{red}{\frac{1}{\sqrt{f_\text{tur}}}}=-2\cdot \log_\text{10}\left(\frac{\varepsilon}{3.71} \right)} ~~~\text{for hydraulically rough pipes} \\[5px]
&f_\text{tur}=\frac{1}{\sqrt{2\cdot \log_\text{10}\left(\frac{3.71}{\varepsilon} \right)}} \\[5px]
\end{align}
Note that although the friction factor decreases with increasing Reynolds number, this does not mean that the pressure loss would be lower. The pressure loss increases according to equation (\ref{def}) with the square of the flow velocity, so that the pressure loss basically increases with increasing flow velocity.
Moody chart
The Moody diagram shows the friction factor as a function of the Reynolds number for selected roughnesses of the pipe wall. In the transition region between laminar and turbulent flow, however, a reliable indication of the friction factor is not possible.
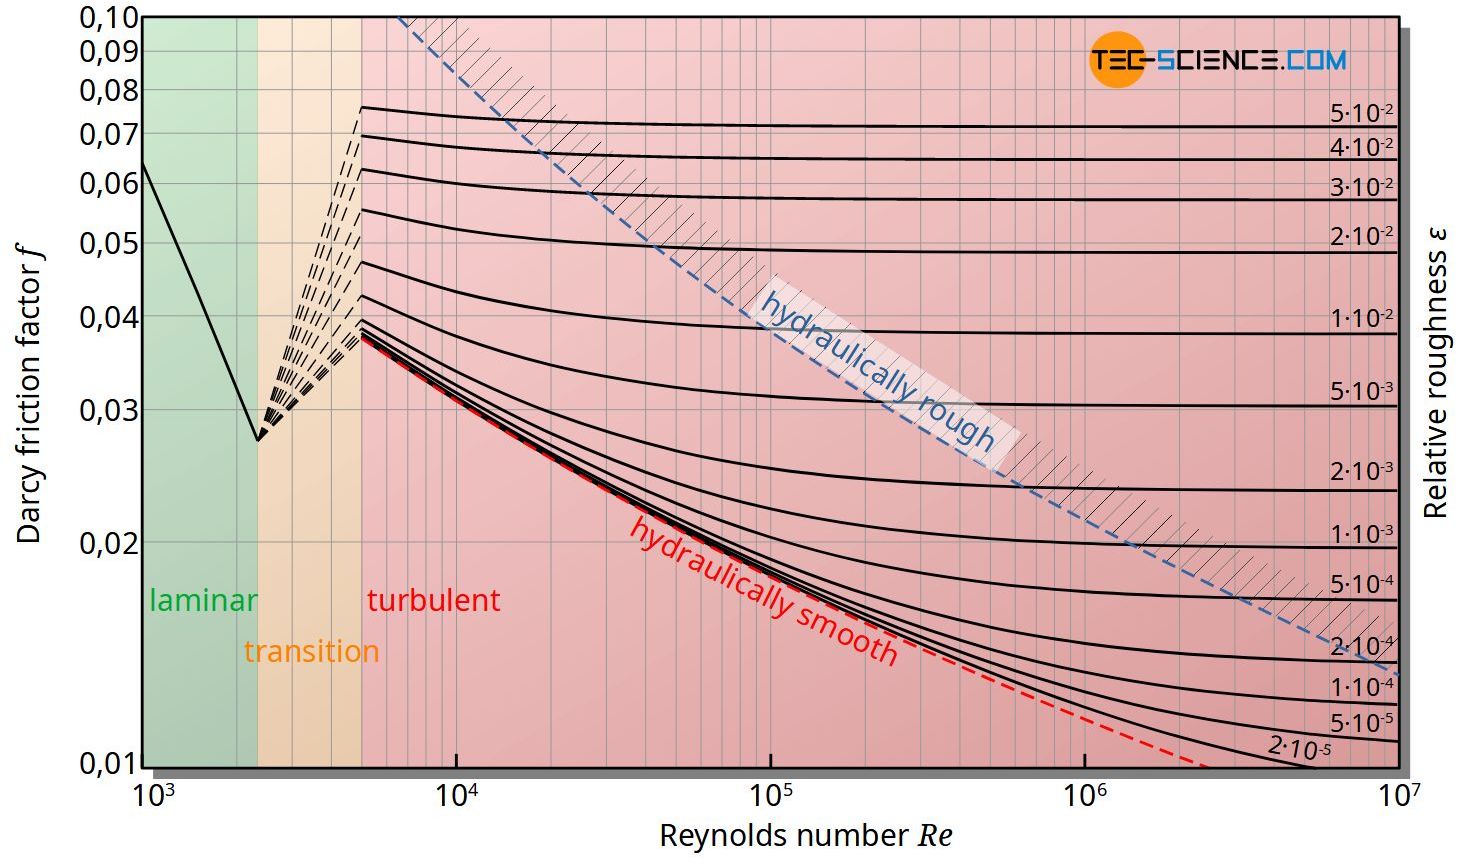
The blue dashed curve in the diagram marks the area of hydraulically rough pipes for which the friction factor is independent of the Reynolds number. The following inequality applies to the hydraulically rough area:
\begin{align}
&\boxed{\sqrt{f}~Re~\varepsilon>200 } ~~~\text{for hydraulically rough pipes} \\[5px]
\end{align}
")


")
")
