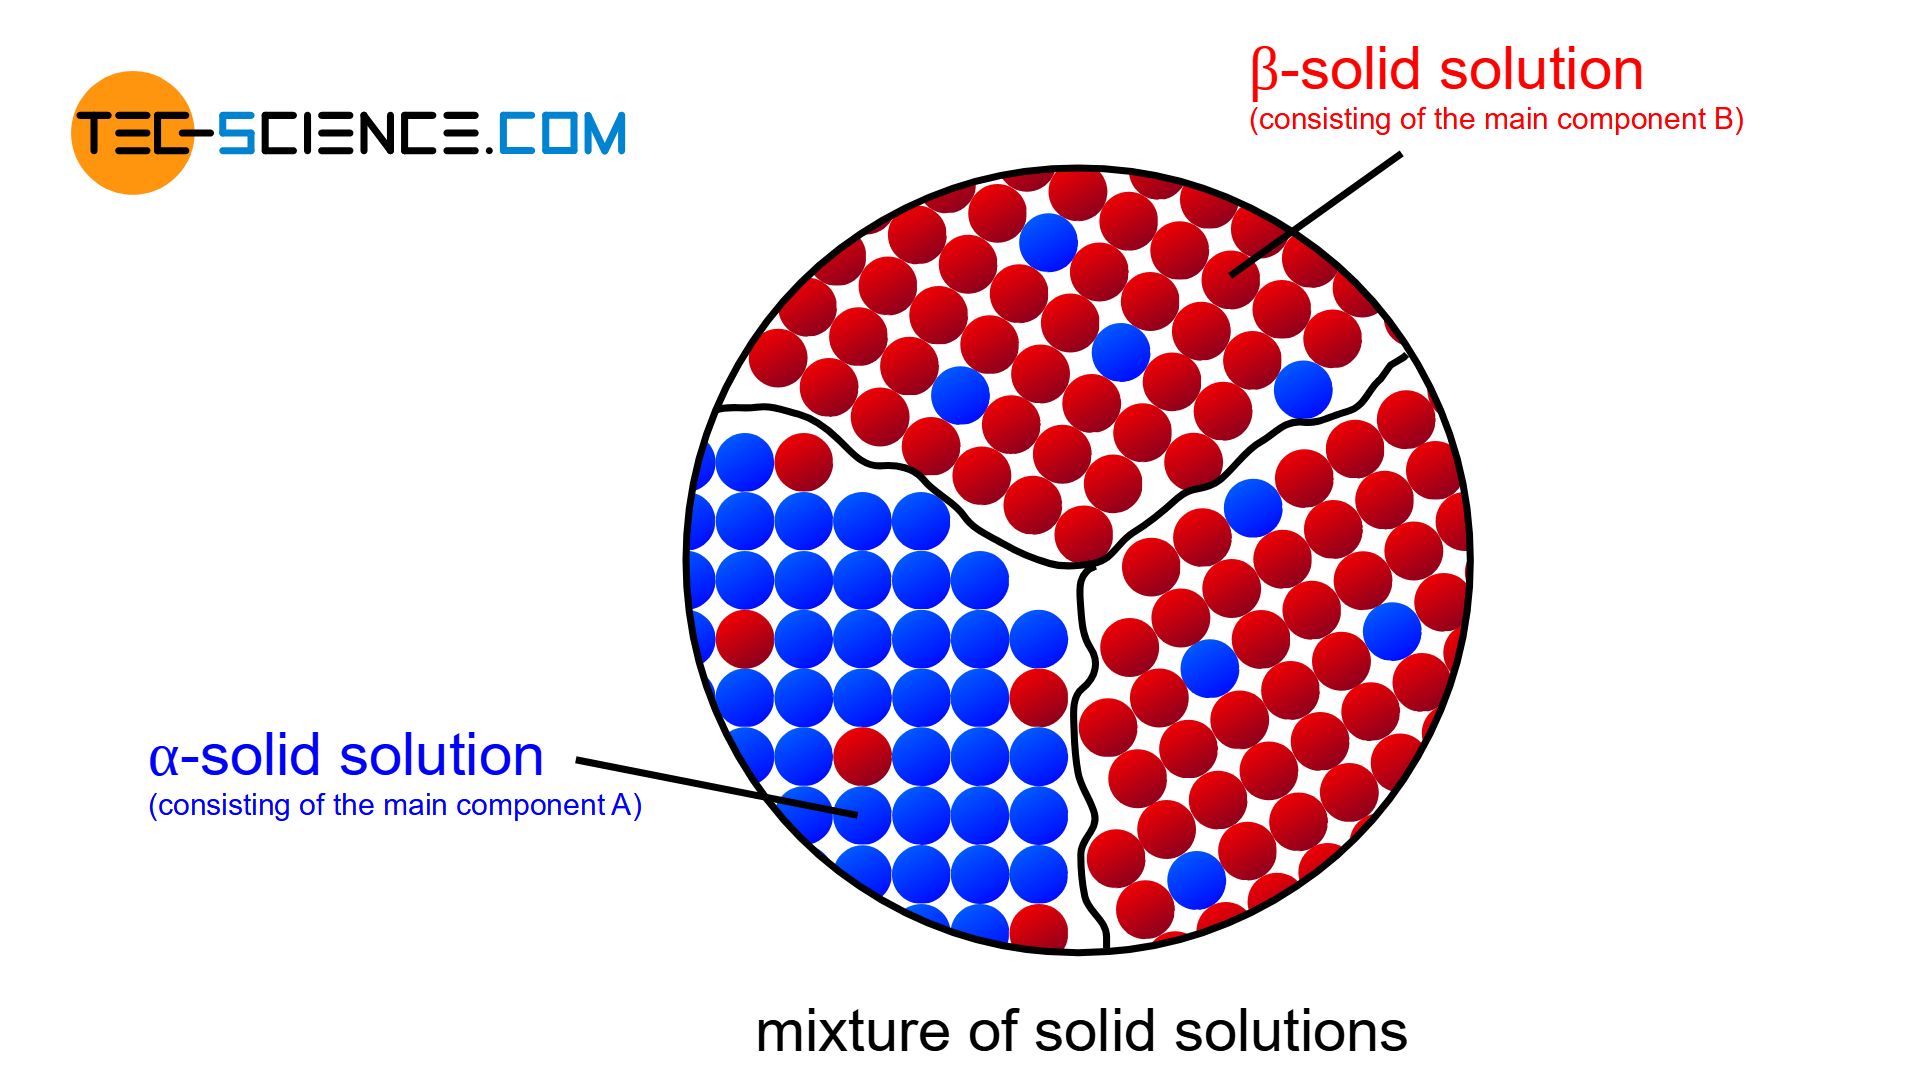
In general, the components of alloys are soluble in each other only to a limited extent. In this case, a mixture of solid solutions is formed.
Introduction
A complete solubility or complete insolubility of the components of a binary alloy system are only special cases. In general, the components are neither completely immiscible nor completely miscible (only complete solubility exists with a complete solid solution series).
In reality, an alloying element B can always be dissolved to a certain degree in the host material A and vice versa. In general, therefore, a limited solubility of the components in the solid state is always obtained.
When the components of an alloy are partially soluble, the microstructure ultimately forms a mixture of solid solutions. Up to a certain percentage of B atoms can then be stored in the crystal of substance A. Conversely, this also applies to the crystal of substance B, in whose lattice atoms of type A can be dissolved to a certain degree.
How to read the phase diagram
In the following sections, a fictitious AB alloy system is described in more detail whose components A and B are only partially miscible in the solid state. The creation of the corresponding phase diagram based on selected cooling curves is not described in detail here. Basic information can be found in the chapter on solid solutions.
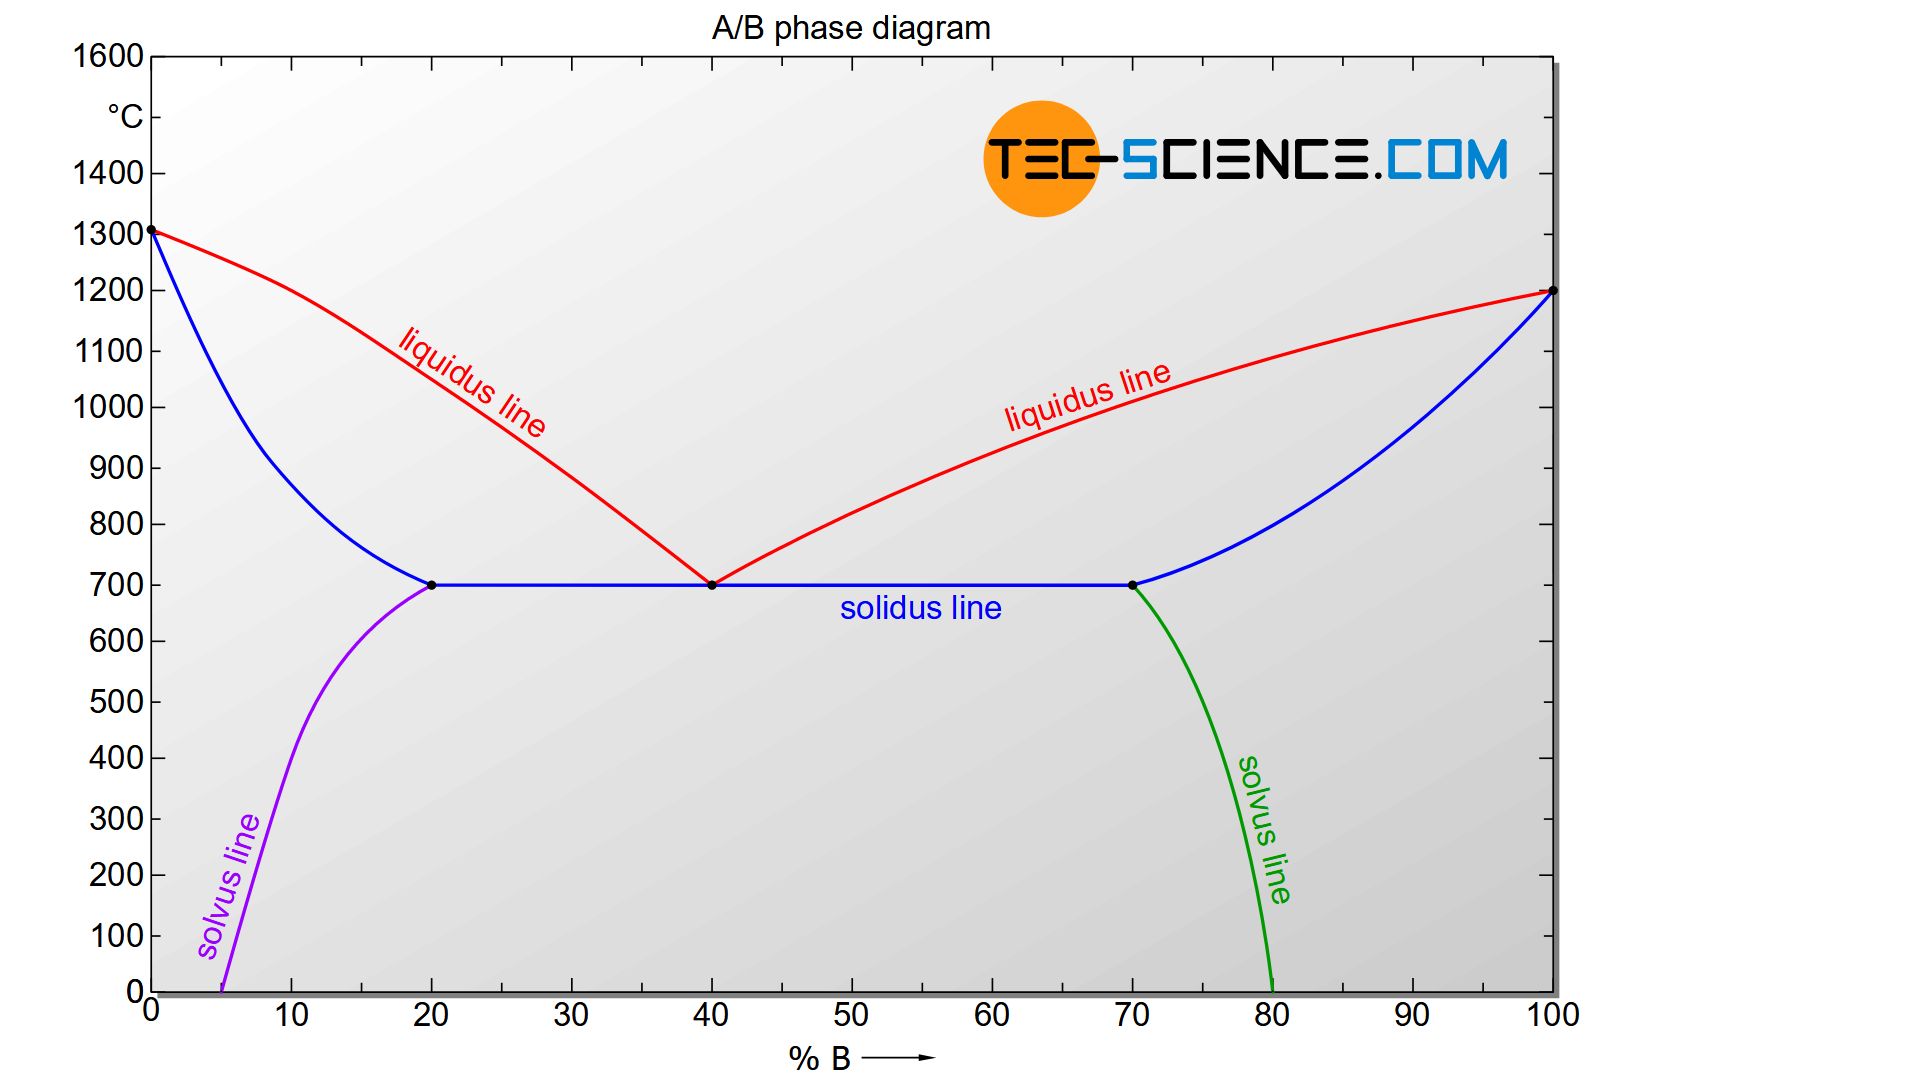
A typical phase diagram of an alloy system with limited solubility is shown in the figure below. This will be discussed in more detail.
Solid solution based microstructure with precipitations
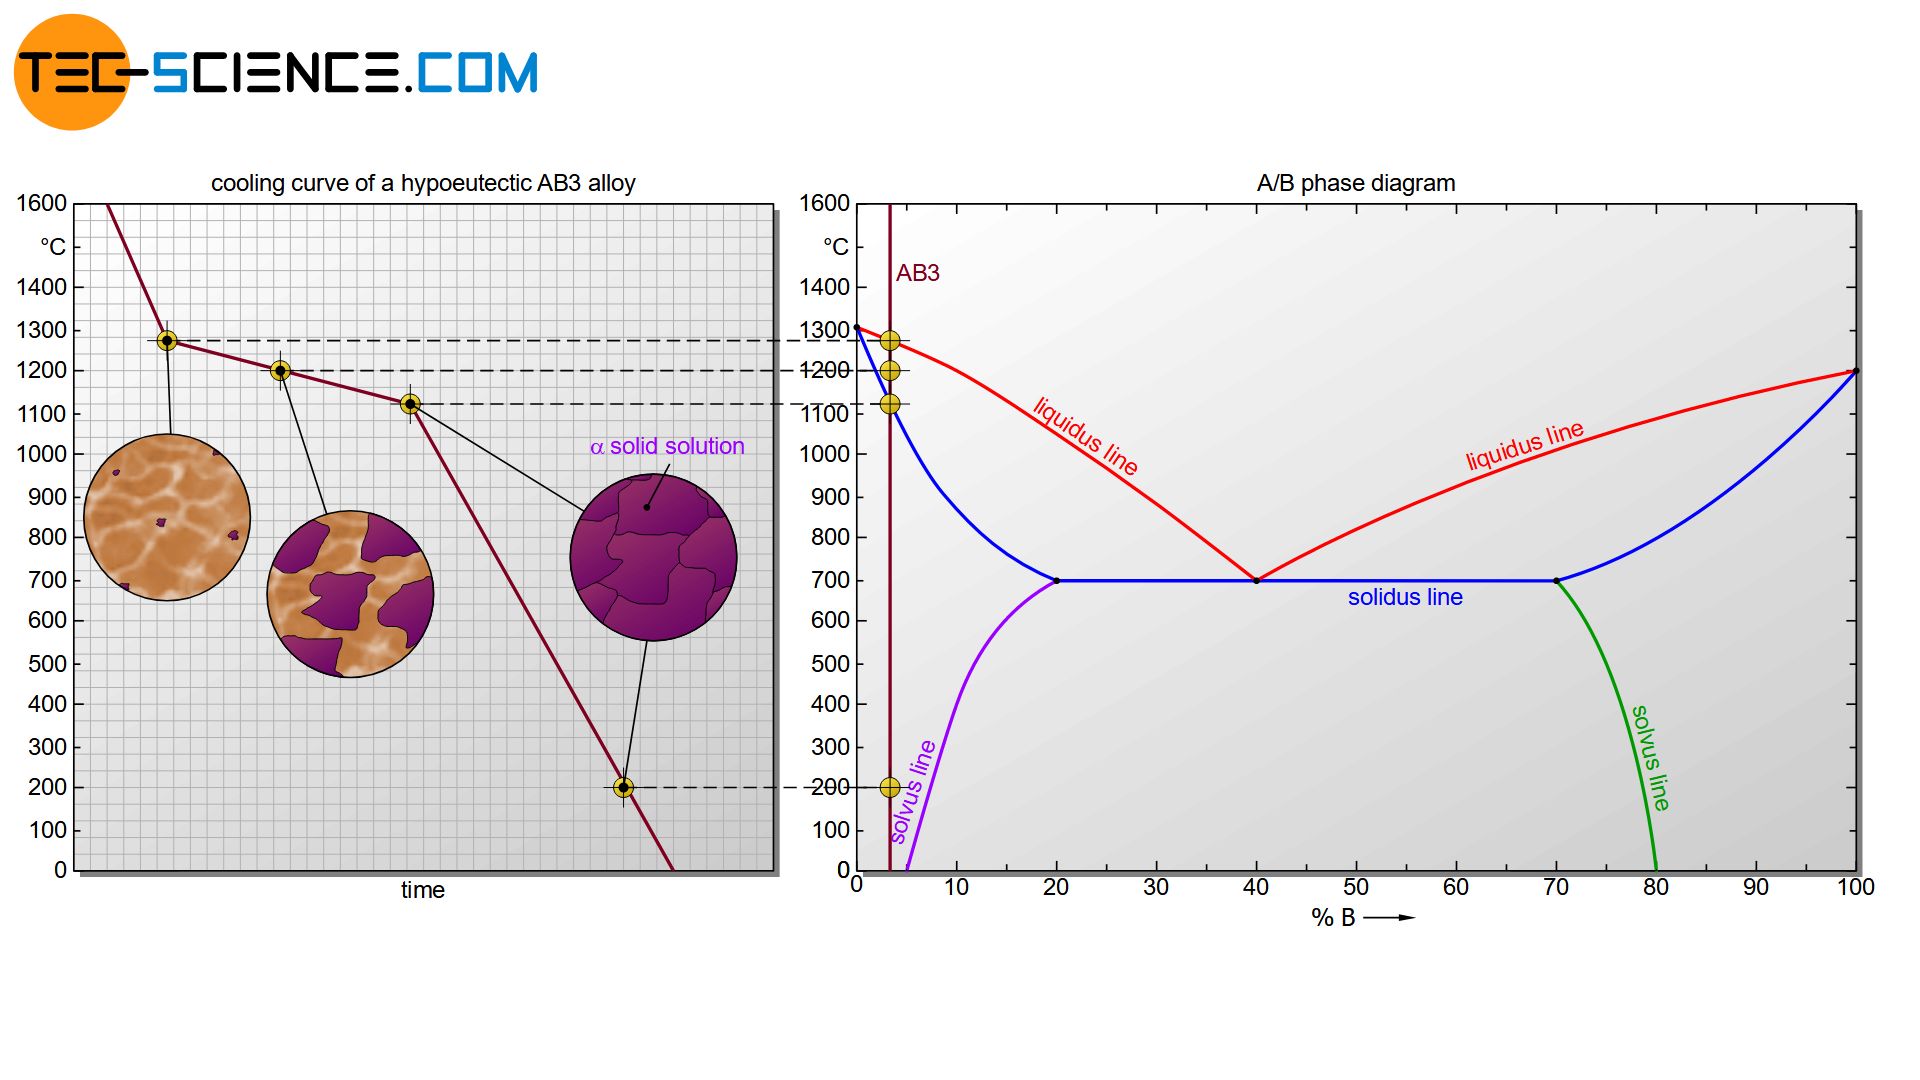
If the solubility limits of the components in the respective other lattice are not exceeded, then the alloy will initially solidify in the same way as a solid solution whose components dissolve completely into one another. After all, it is perfectly miscible below the solubility limit. The cooling curve of such an alloy first shows the known solidification range (flattening cooling curve) within the alloy solidifies completely. In the following, the alloy AB10, which consists of 10 % B atoms, will be considered as an example for this case.
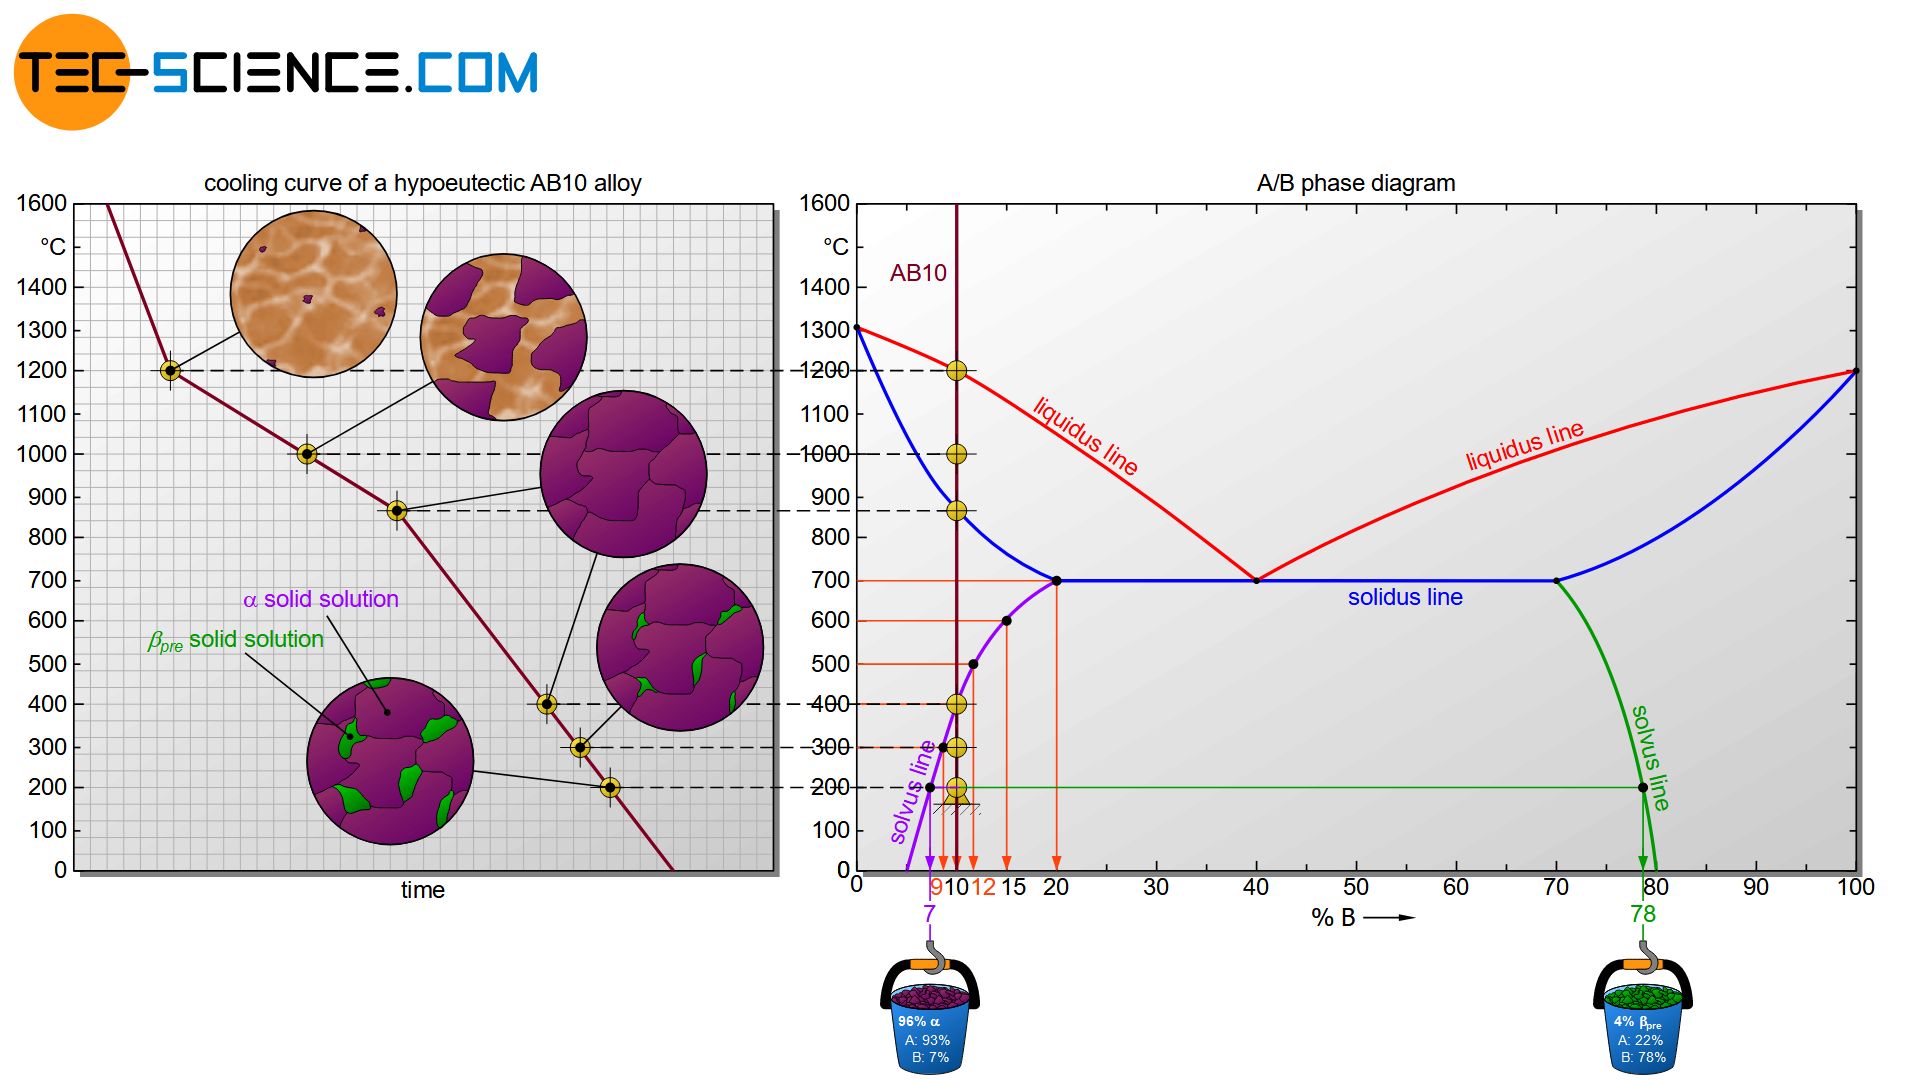
When the AB10 alloy solidifies, the phase diagram first passes through the known two phase region consisting of melt and solid solution. In this two phase region, the chemical composition of the phases can again be determined by drawing a perpendicular line from the liquidus line (composition of the melt) or solidus line (composition of the solid solution) onto the concentration axis. The phase fractions at a certain temperature can also be determined using the lever rule.

Immediately after solidification, component B is completely dissolved in the lattice of the host substance A at 10 % due to its relatively low concentration. However, solubility generally decreases with decreasing temperature. This can be explained by the decreasing lattice vibrations at decreasing temperature. Because with decreasing lattice vibrations, the space between the atoms also decreases.
Atoms embedded in the “shrinking” lattice can then no longer be held and are “pressed out” of the microstructure, so to speak. These atoms form precipitations (precipitates). The formation of such precipitations due to the solubility limit is also called precipitation or segregation. The line in the phase diagram showing the solubility limit is also referred to as solvus line (Solvus).
Segregation or is the formation of a phase from an existing microstructure due to the solubility limit! The formed segregations are also called precipitations or precipates!
The solvus lines for the respective components are shown in the phase diagram in purple and green. They therefore reflect the maximum solubility of the stored component.
As the temperature drops, the solubility of the components in the other lattice decreases!
The solvus line shows that the host substance A has its maximum solubility at a temperature of 700 °C and can store 20 % B atoms. At this temperature, the entire B atoms of the alloying element remain dissolved in the lattice structure of the host material A.
However, as the temperature drops, the solubility decreases more and more. At a temperature of 600 °C, for example, only a maximum of 15 % and at 500 °C only a maximum of 12 % of B atoms can be dissolved in the lattice of host substance A.
Finally, at 400 °C exactly the existing concentration of 10 % B atoms is reached. At this temperature, the lattice structure of the host component A can just exactly dissolve the entire B atoms. This is also known as a saturated \(\alpha\) solid solution.
\(\alpha\) solid solution is a solid solution consisting mainly of the host component and having dissolved relatively small amounts of alloying elements therein!
If this state is further cooled down, then obviously fewer B atoms can be dissolved in the A-lattice than are still present in the solid solution. So far, the solid solution still has 10 % B atoms, but at 300 °C only a maximum of 9 % and at 200 °C only 8 % can be dissolved. The “too many” B atoms that can no longer be dissolved are therefore precipitated from the A-lattice. The \(\alpha\) solid solution thus always remains saturated to the maximum solubility.
However, no pure B crystals will form during precipitation. Rather, B-rich \(\beta\) solid solutions will form or separate from the lattice (also called \(\beta_{pre}\)-solid solutions). The chemical composition of the \(\beta_{pre}\) can be determined by drawing a perpendicular line from the corresponding solvus line onto the concentration axis (here: 78 % B; 22 % A). Obviously, the \(\beta_{pre}\) always contains a certain amount of A atoms, depending on the temperature!
\(\beta\) solid solution is a solid solution consisting mainly of the alloying element and having dissolved relatively small amounts of the host material in it!
The microstructure fraction of \(\beta_{pre}\) in total can be determined at a given temperature by the lever rule. At a temperature of 200 °C, a microstructure fraction of about 4 % is obtained for the \(\beta_{pre}\) solid solution. Correspondingly, this leads to a microstructure fraction of about 96 % for the \(\alpha\) solid solution.
\begin{align}
\underline{\beta_{pre}} &= \frac{10-7}{78-7} \cdot 100 \text{ %} = \underline{4 \text{ %}} \\[5px]
\underline{\alpha} &= \frac{(78-10)}{(78-7)} \cdot 100 \text{ %} = \underline{96 \text{ %}} \\[5px]
\end{align}
When the solubility limit is undershot, the precipitated solid solution is formed by diffusion processes. Due to the low temperature and the crystal structure already present, these processes take place relatively slow. The precipitations are therefore often limited to very small regions and take place preferably at energetically favourable locations such as grain boundaries, dislocations, inclusions, vacancies, etc.
As the cooling process continues, the solubility of the B atoms in the lattice of component A decreases more and more. B atoms in the form of B-rich \(\beta\) solid solutions are therefore further precipitated, whereby their chemical composition also changes permanently as can be read off from the solvus line.
Note that all precipitation processes take place in an already completely solidified state.
Eutectic microstructure
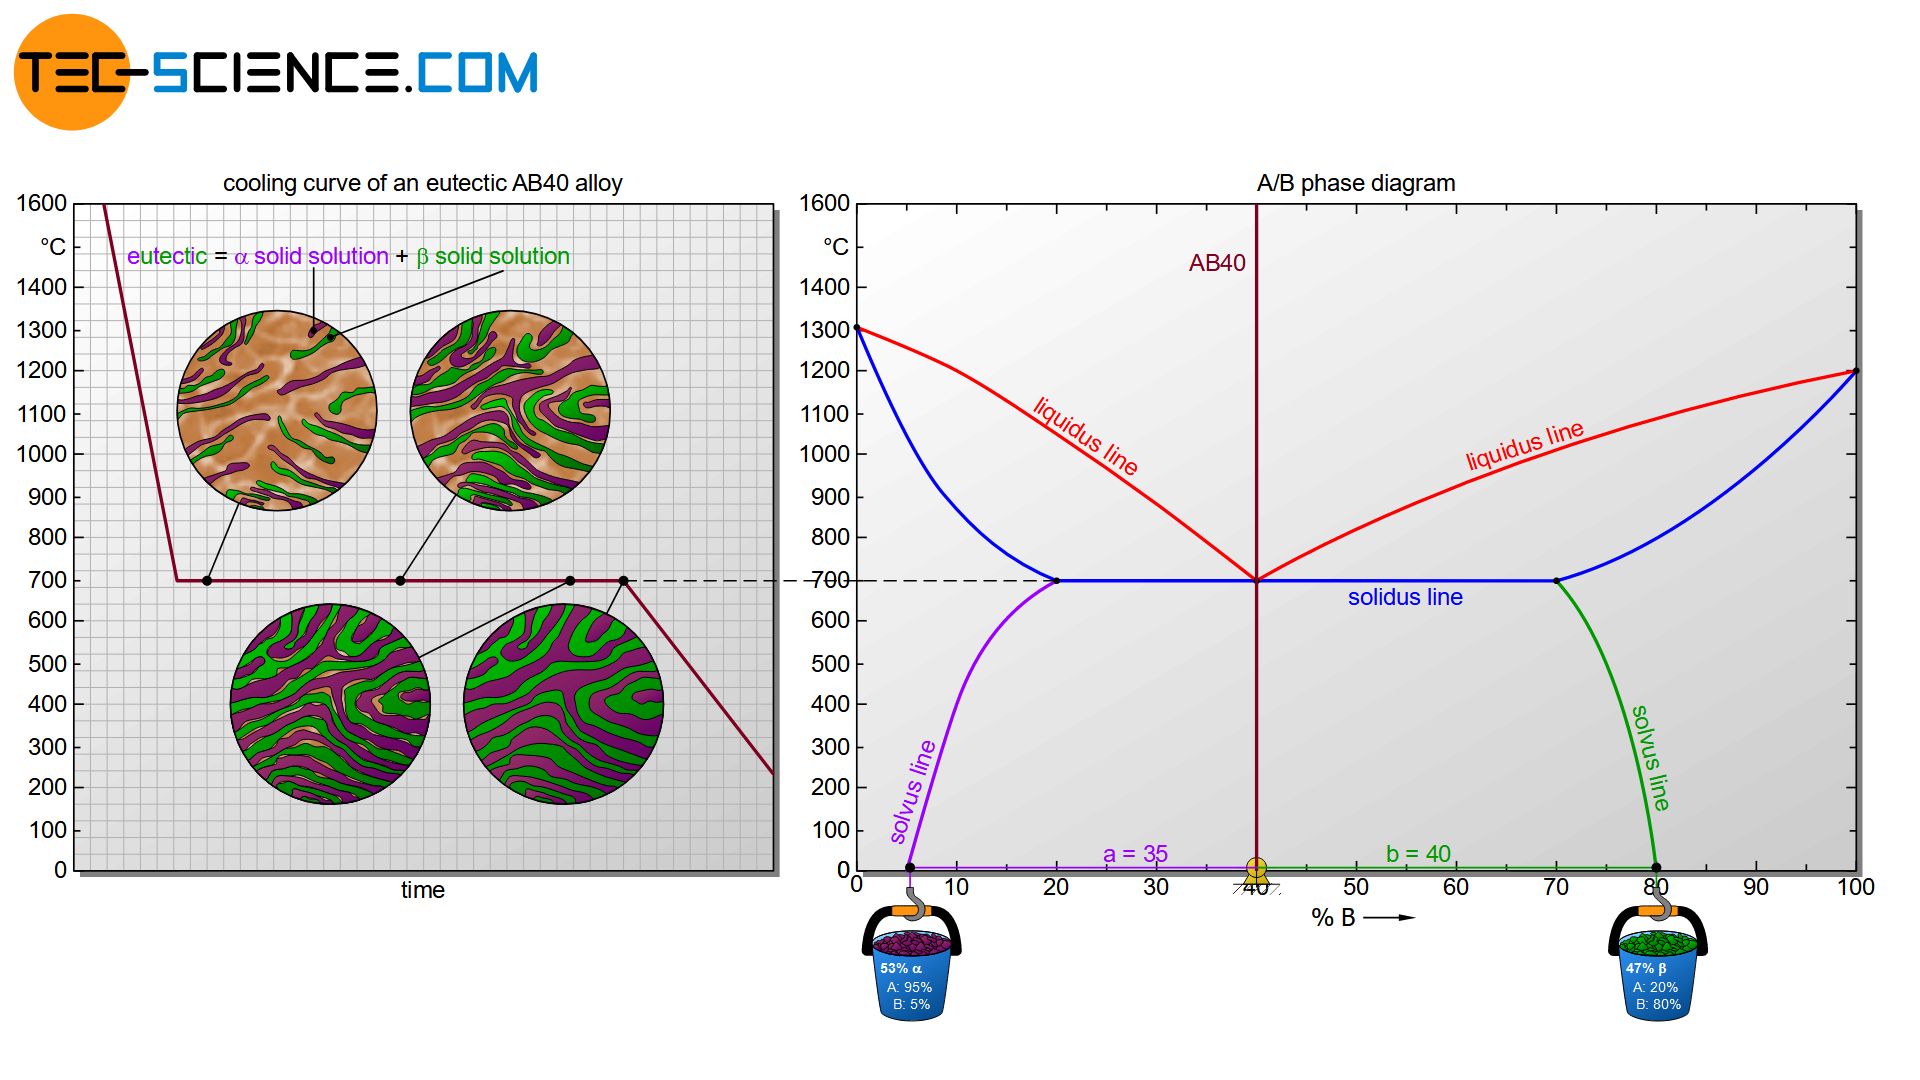
In addition to the lens-shaped two phase region typical of solid solutions, the phase diagram also contains liquidus lines which meet at a common point. This is the already known eutectic point that one obtains in case of an alloy systems whose components are completely insoluble in one another. The formation of the microstructure of the eutectic AB40 alloy is therefore similar. In turn, such an alloy does not solidify in a temperature range but at a certain temperature with a respective thermal arrest.
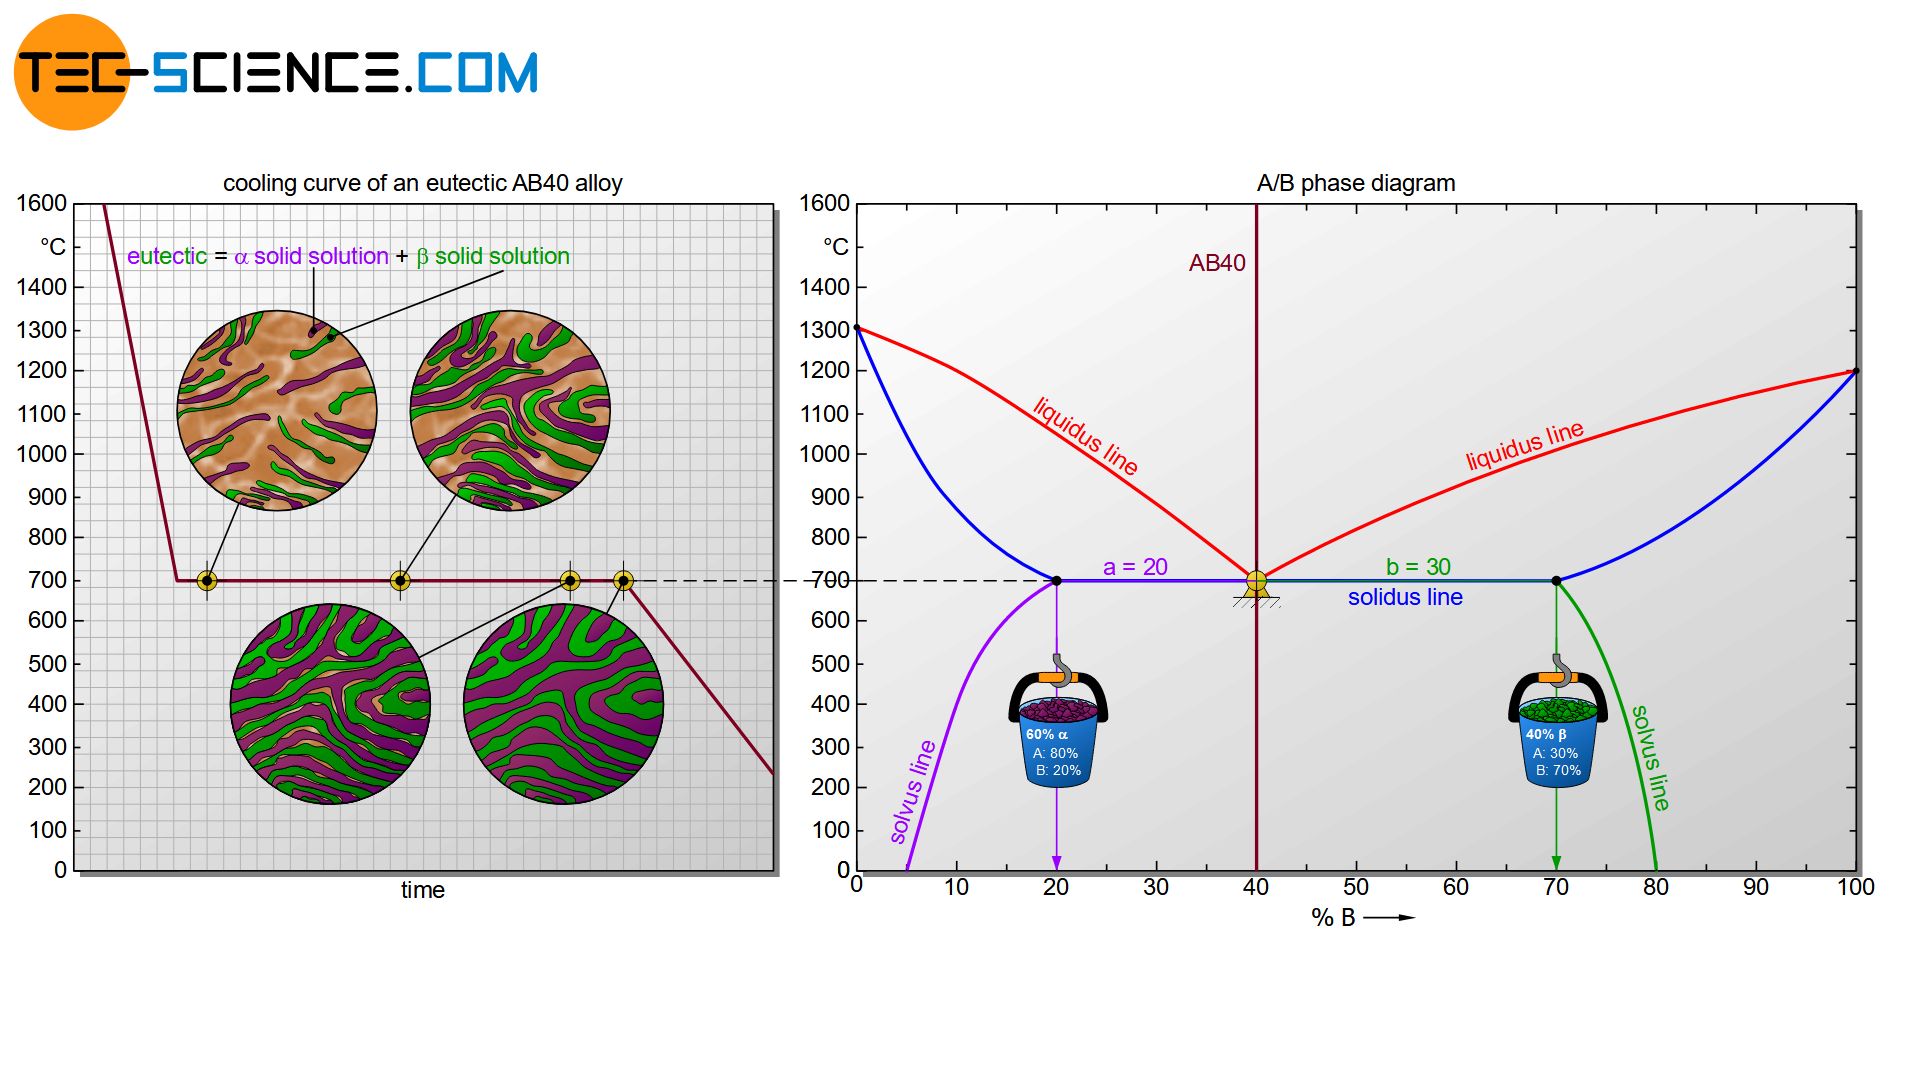
The only difference is that no pure crystals of atomic type A or B are formed during the solidification process, but \(\alpha\) solid solutions and \(\beta\) solid solutions. The respective components contain the other type of atom in their lattice structures according to their solubility. Immediately after solidification, a chemical composition of 80 % A and 20 % B can be read from the phase diagram for the \(\alpha\) solid solution (see figure above). For the \(\beta\) solid solution a chemical composition of 30 % A and 70 % B results according to its solubility. As is usual with eutectic alloys, a very fine-grained or rather fine-lamellar microstructure is present due to the strong supercooling.
In the further course of cooling, the composition of the two different solid solutions changes by diffusion processes. The \(\alpha\) solid solution at room temperature (~0 °C) consists of 95 % A and 5% B and the \(\beta\) solid solution of 20 % A and 80 % B. Finally, the microstructure fractions can also be determined using the lever rule. In this case, the \(\alpha\) solid solution has a microstructure fraction of about 53 % and the \(\beta\) solid solution has a microstructure fraction of about 47 %. For further basic information on the determination of the microstructure fractions, please read the article Complete insolubility of components in solid state.
Hypoeutectic based microstructure with precipitations
In the following, the hypoeutectic alloy AB25 is considered. This alloy will crystallize in a solidification range between 960 °C and 700 °C. When the liquidus line is reached, \(\alpha\) solid solutions will first precipitate. Their composition can be determined by drawing a perpendicular line from the solidus line onto the concentration axis. For example, the \(\alpha\) solid solutions consist of 13% B atoms (or 87% A atoms) at a temperature of 800°C.
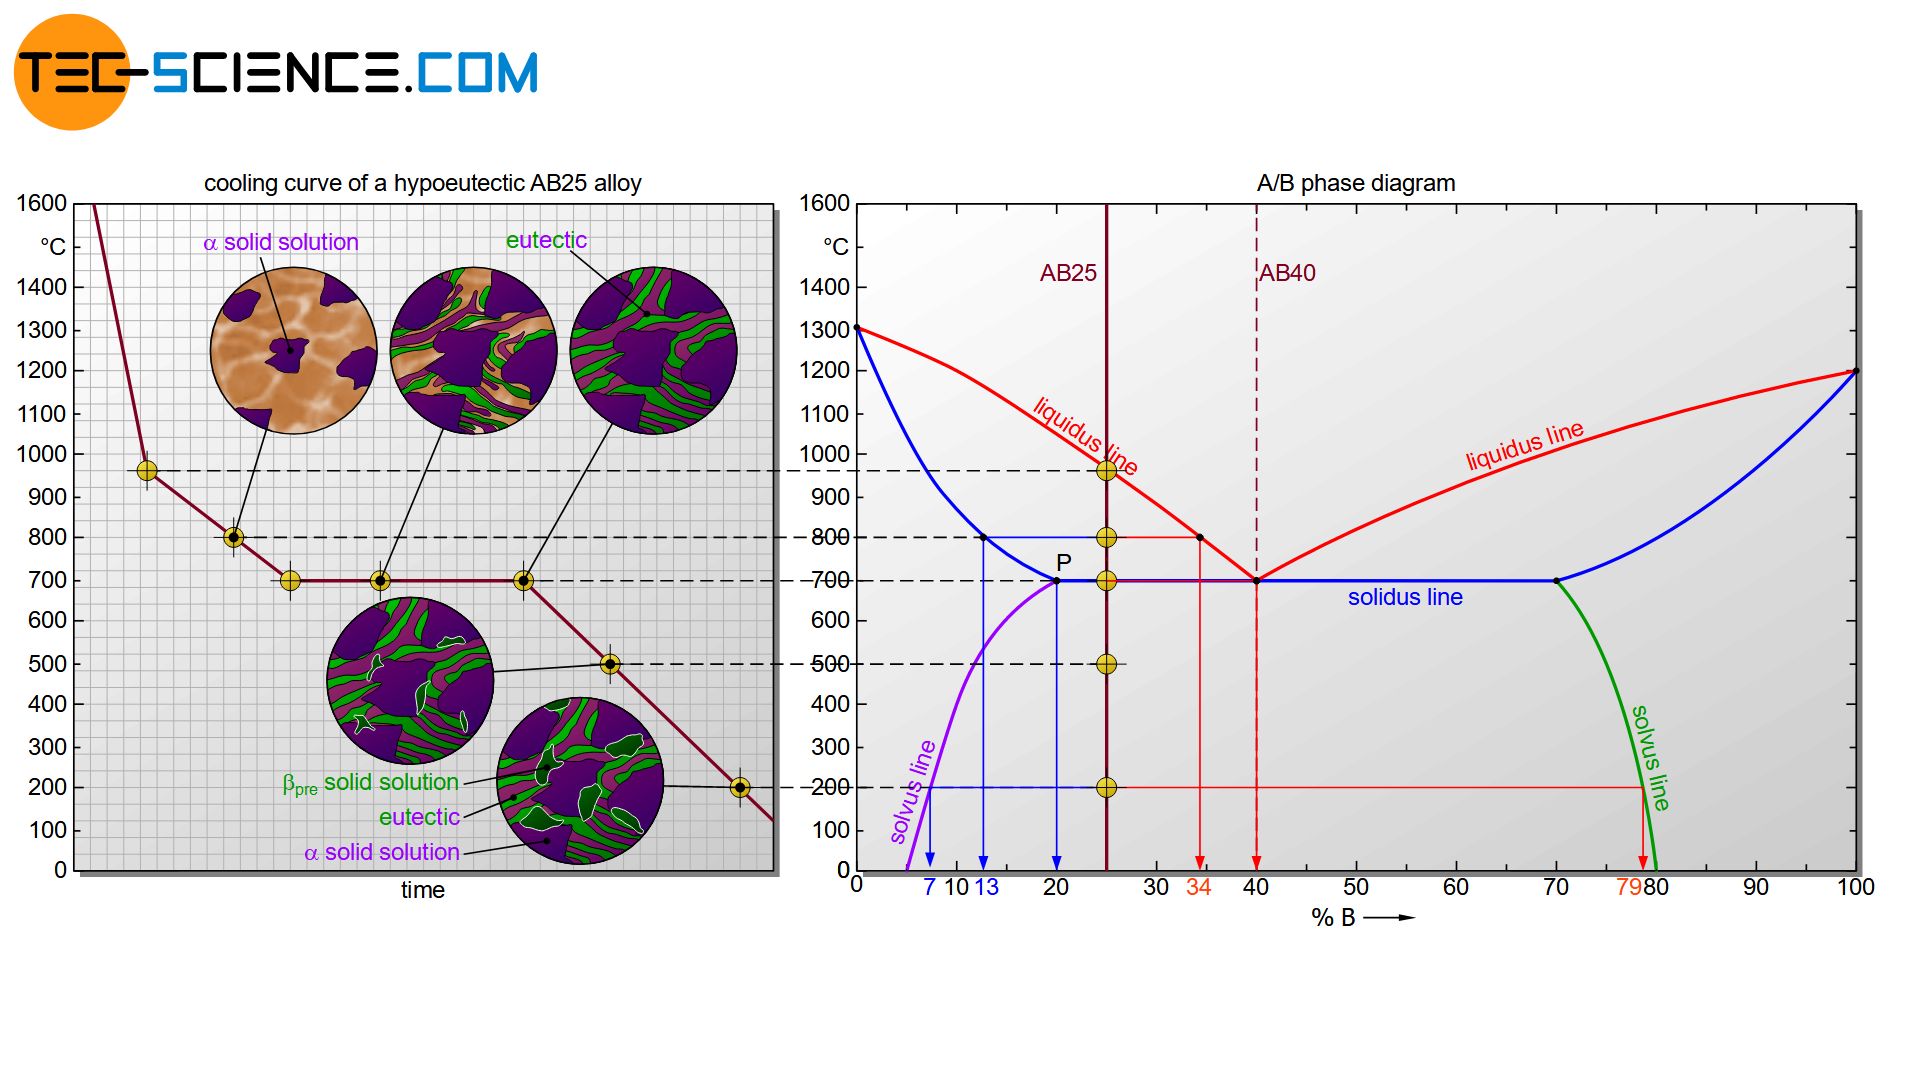
The precipitation of the A-rich \(\alpha\) solid solutions causes the melt to become poor in A atoms. Consequently, the concentration of B atoms in the melt increases. The increase in concentration for the melt can be determined by drawing a perpendicular line from the solidus line onto the concentration axis again.
At 800 °C, the residual melt has a concentration of 34 % B. It becomes apparent that as the temperature decreases, the melt increasingly approaches the eutectic composition according to the liquidus line. Finally, the eutectic composition in the residual melt is reached at 40 % B at 700 °C. The remaining melt now behaves like a eutectic AB40 alloy and solidifies in a thermal arrest to the eutectic (finely distributed \(\alpha\) and \(\beta\) solid solution).
Immediately after complete solidification of the microstructure, the \(\alpha\) solid solutions precipitated from the melt have a composition corresponding to point P (20 % B). However, the solubility of the B atoms in this \(\alpha\) solid solution now decreases with decreasing temperature. B atoms in the form of \(\beta_{pre}\) solid solutions are therefore precipitated at the grain boundaries during further cooling. Their composition can be read off again at the corresponding solvus line (green line).
Thus, the \(\beta_{pre}\) solid solutions at a temperature of 200 °C have a concentration of B atoms of about 79%, while the \(\alpha\) solid solutions contain only 7% B atoms. The latter concentration applies both to the \(\alpha\)-solid solution precipitated from the melt and to the \(\alpha\)-solid solution of the eutectic formed from the melt!
At room temperature there is thus a eutectic based microstructure, consisting of finely distributed \(\alpha\) and \(\beta\) solid solutions. The primarily formed \(\alpha\) solid solutions during solidification of the melt are embedded therein. In addition, there are \(\beta_{pre}\) solid solution crystals precipitated at the grain boundaries due to decreasing solubility during cooling.
Hypereutectic based microstructure with precipitations
The processes for a hypereutectic alloy are similar to those for a hypoeutectic alloy. The only difference is that \(\beta\) solid solutions are precipitated from the melt after reaching the liquidus line. The concentration of B atoms will decrease during cooling acording to the liquidus line. Once the eutectic composition is finally reached in the residual melt, it will transform into the eutectic.
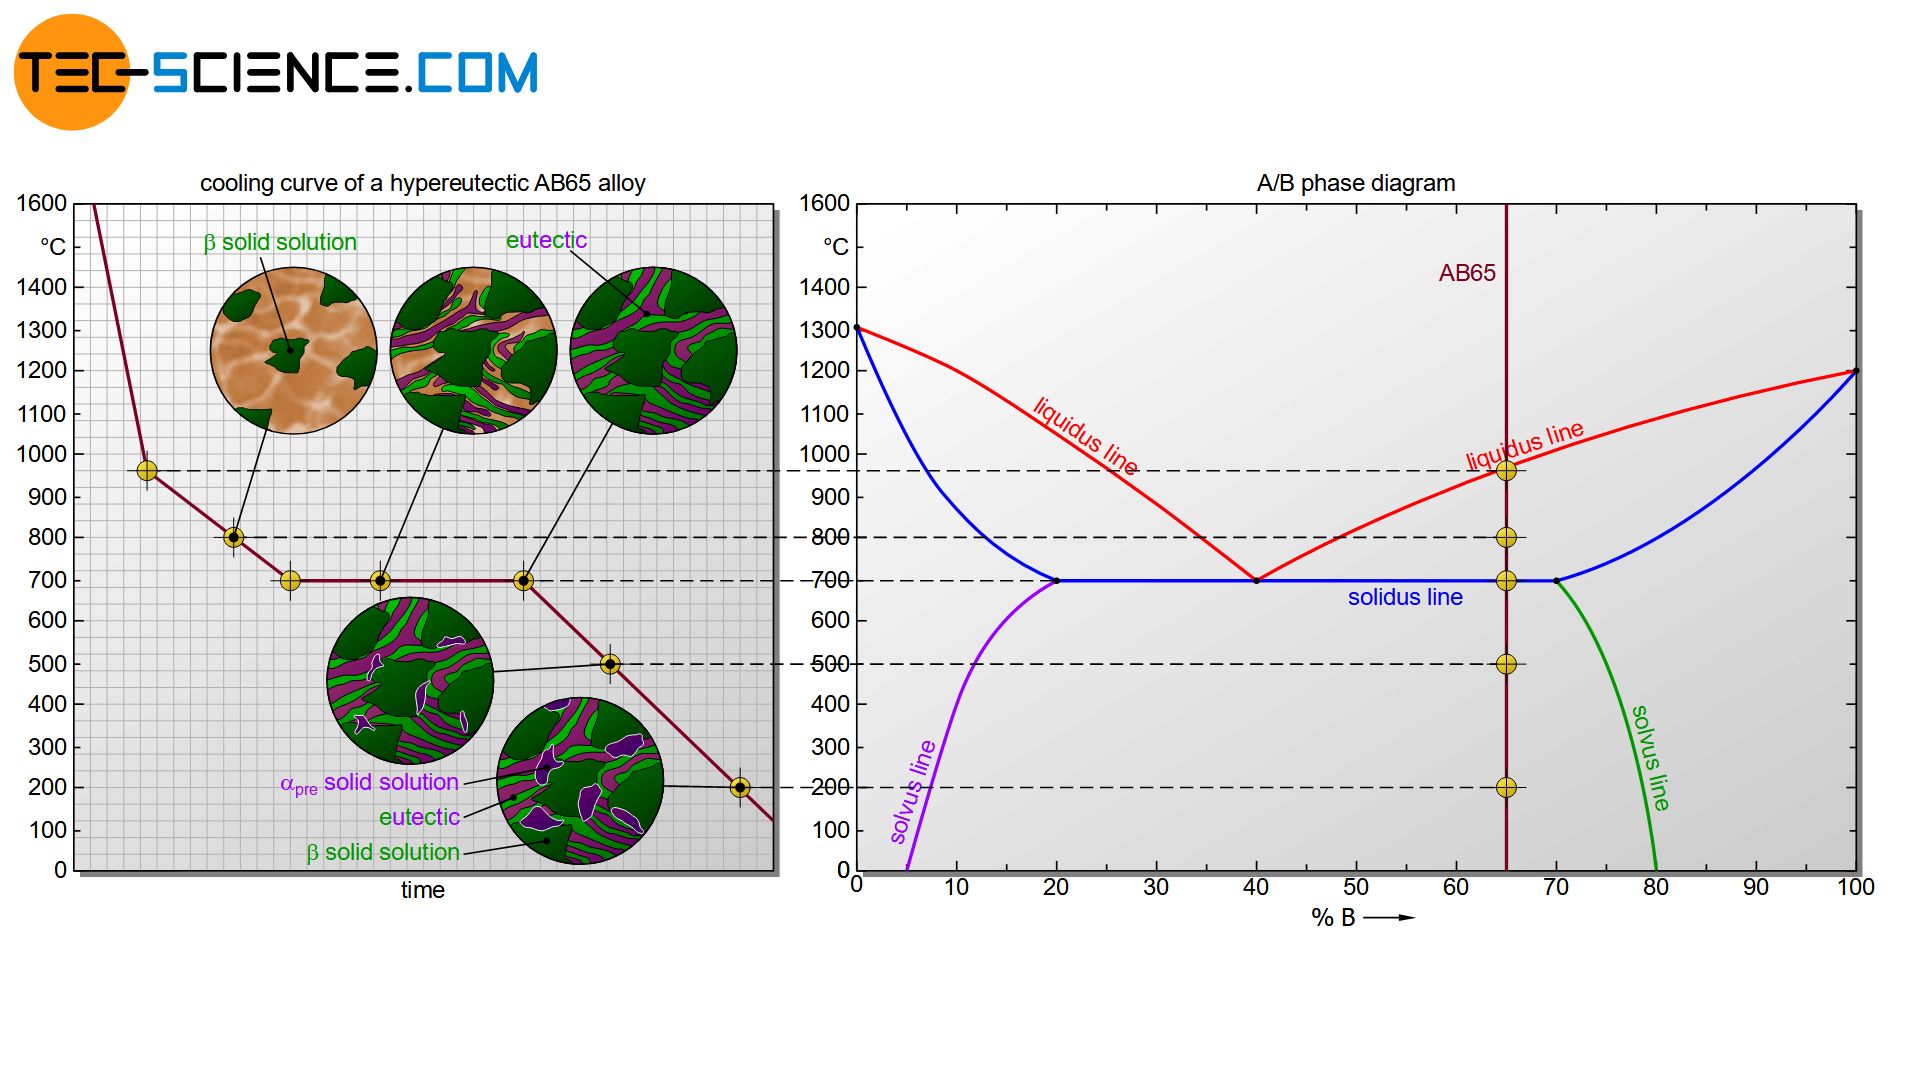
If the solubility limit of the \(\beta\) solid solution primarily precipitated from the melt is undershot, then this time A-rich \(\alpha\) solid solution is precipitated at the grain boundaries. The microstructure then consists of a eutectic based microstructure. The primarily formed \(\beta\) solid solutions during solidification of the melt are embedded therein as well as \(\alpha_{pre}\) solid solutions precipitated at the grain boundaries.
Solid solution microstructure without precipitations
For alloy concentrations below 5 % B, the solubility limit down to room temperature is always above the existing alloy concentration. In this case, neither eutectic solidification (the melt is completely solidified before it could have reached the eutectic composition) nor precipitation takes place, since the entire B atoms can always be dissolved in the host lattice. In this case, the microstructure consists of a single solid solution phase (\(\alpha\) solid solution).
In principle, the same situation applies to alloys with an alloy concentration of more than 80 % B atoms according to the phase diagram. In this case, the microstructure consists of only one \(\beta\) solid solution phase.
Microstructure diagram
To determine the microstructure fractions at room temperature relatively easily, it is helpful to create an microstructure diagram. In principle, the creation of such a diagram is carried out in the same way as in the case of an alloy whose components are completely immiscible – by applying the lever rule in the phase diagram at room temperature (~ 0 °C).
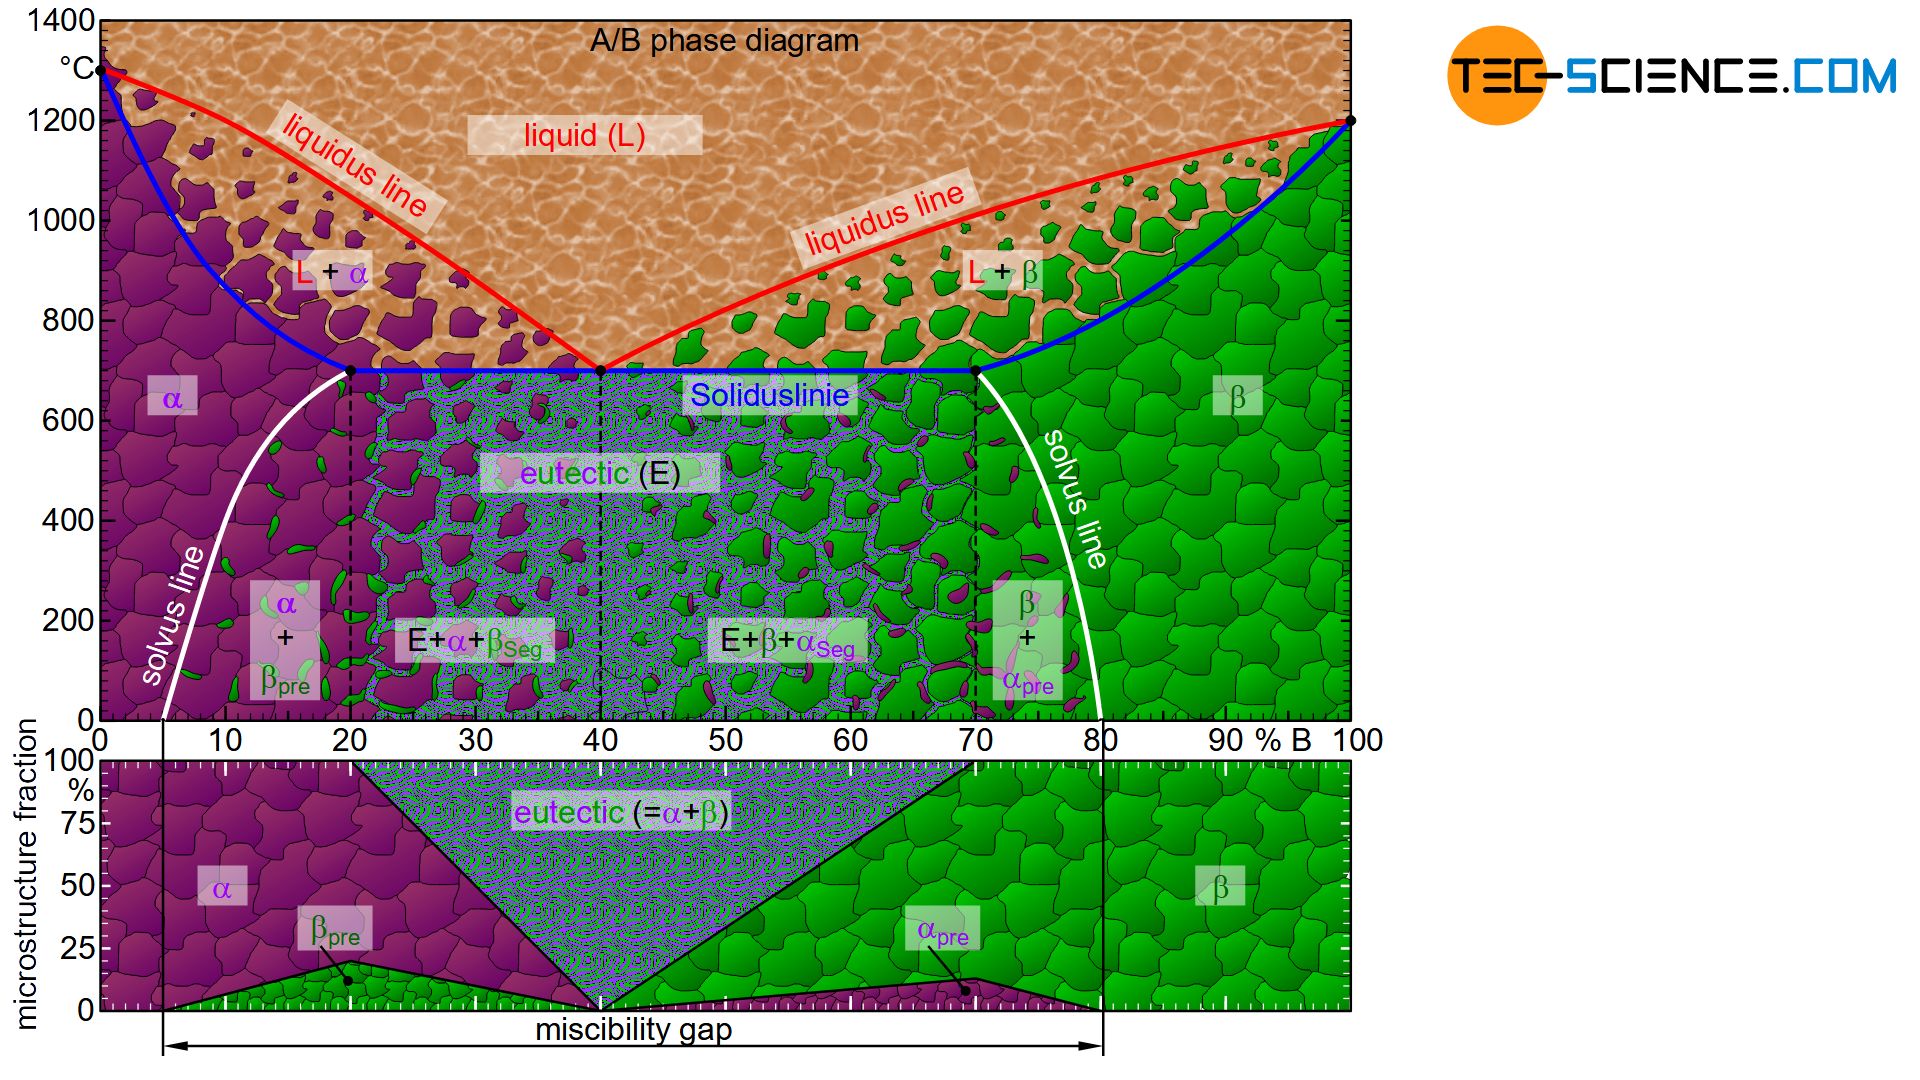
Initially, the microstructure consists entirely of \(\alpha\) solid solutions up to an alloying element content of 5 %. At higher concentrations, \(\beta\) solid solutions are increasingly precipitated due to the limited solubility (\(\beta_{pre}\)). Most \(\beta_{pre}\) solid solutions will form when the microstructure is fully saturated immediately after solidification, so that \(\beta_{pre}\) solid solutions will precipitate immediately upon further cooling. This is the case for an alloy concentration of 20 % B. Due to the linear displacement of the imaginary fulcrum when applying the lever rule, the microstructure fraction of the \(\beta_{pre}\) solid solution also increases linearly up to the already said maximum.
At higher concentrations of B atoms, additional eutectic components (\(Eu\)) are formed, while the fraction of precipitated \(\beta_{pre}\) solid solutions decreases again. The eutectic microstructural components increase linearly up to the eutectic composition and finally reach 100 %.
Hypereutectic alloys precipitate \(\beta\) solid solutions from the melt before the eutectic forms. As the alloy concentration in the hypereutectic range increases, the eutectic microstructures decrease in favor of the \(\beta\) solid solutions. In addition, the fraction of \(\alpha_{pre}\) solid solutions precipitated increases due to the limited solubility. The maximum fraction of \(\alpha_{pre}\) precipitations is finally obtained at 70 % B, since the \(\beta\) solid solution formed there is saturated to the maximum immediately after solidification and thus \(\alpha_{pre}\) solid solution is precipitated directly. In this case, the microstructure no longer contains any eutectic, as the microstructure is solidified before the eutectic composition could have reached in the melt.
When the alloy concentration is further increased, the fraction of \(\alpha_{pre}\) solid solution decreases to the maximum solubility limit of 80 % B and finally reaches zero. From that point on, the microstructure consists only of \(\beta\) solid solutions.
Note: The concentration range between the pure solid solution microstructures, within which several phases occur in the microstructure, is also referred to as the miscibility gap.
Aging
The precipitation processes that occur through diffusion processes when the solubility limit is undershot always take certain time. However, this time can be taken away by rapid cooling (known as quenching). As a result, some of the normally insoluble alloying element atoms remain forcibly dissolved in the host lattice, as the time is taken for them to diffuse out. This leads to correspondingly strong lattice distortions and can lead to enormous increases in strength, as the dislocation movement is made more difficult by the lattice distortions and the forcely dissolved atoms.
The solid solutions are thus in an oversaturated state when rapidly cooled to room temperature and are not in thermodynamic equilibrium. In principle, however, each system strives for a thermodynamic equilibrium. For this reason, precipitates from the supersaturated solid solution will form over time, even at room temperature. However, due to the low diffusibility at such low temperatures, this process takes much longer. This can be a question of days, weeks, months or even years. By striving for a thermodynamic equilibrium state or the subsequent formation of precipitations, the original properties of the material naturally change over time. This process is also known as the aging.
Aging is the (usually negative) change in the properties of a material due to precipitation processes!
The aging process increases with rising temperature, since diffusion processes are correspondingly faster at higher temperatures. Thus, a material can be artificially aged by heating in order to investigate the effects of aging in economic times. Ageing phenomena in steels are primarily due to nitrogen and carbon. Over time, these are separated from the supersaturated ferrite lattice in the form of iron nitride and iron carbide and cause the steel to become unwantedly brittle.
However, aging processes do not always have to have a negative influence on material properties. In some cases, the desired properties only occur with the formation of precipitates and thus with aging (see article on precipitation hardening).
This is the case, for example, with so-called precipitation hardenable aluminium alloys. An important material representative in this context is duralumin, an alloy of aluminum and copper as well as other alloying elements such as iron and magnesium. Immediately after quenching, this alloy is relatively soft and can be easily formed or processed. Only through the subsequent aging process of one to two days does the alloy achieve its strength and hardness. In this case, the desired aging process is also referred to as artificial aging.
Artificial aging is the desired aging process of a material in order to maintain its wanted properties!

")
