If the components of an alloy are completely soluble in each other in the solid state, then solid solutions form.
Introduction
If the two components of an alloy (binary system) are completely soluble in each other in the solid state, one speaks of a solid solution alloy. In this case, the two components form a common crystal lattice, which is made up of both the atoms of the host material and the atoms of the alloying element (for more information, see article types of alloys).
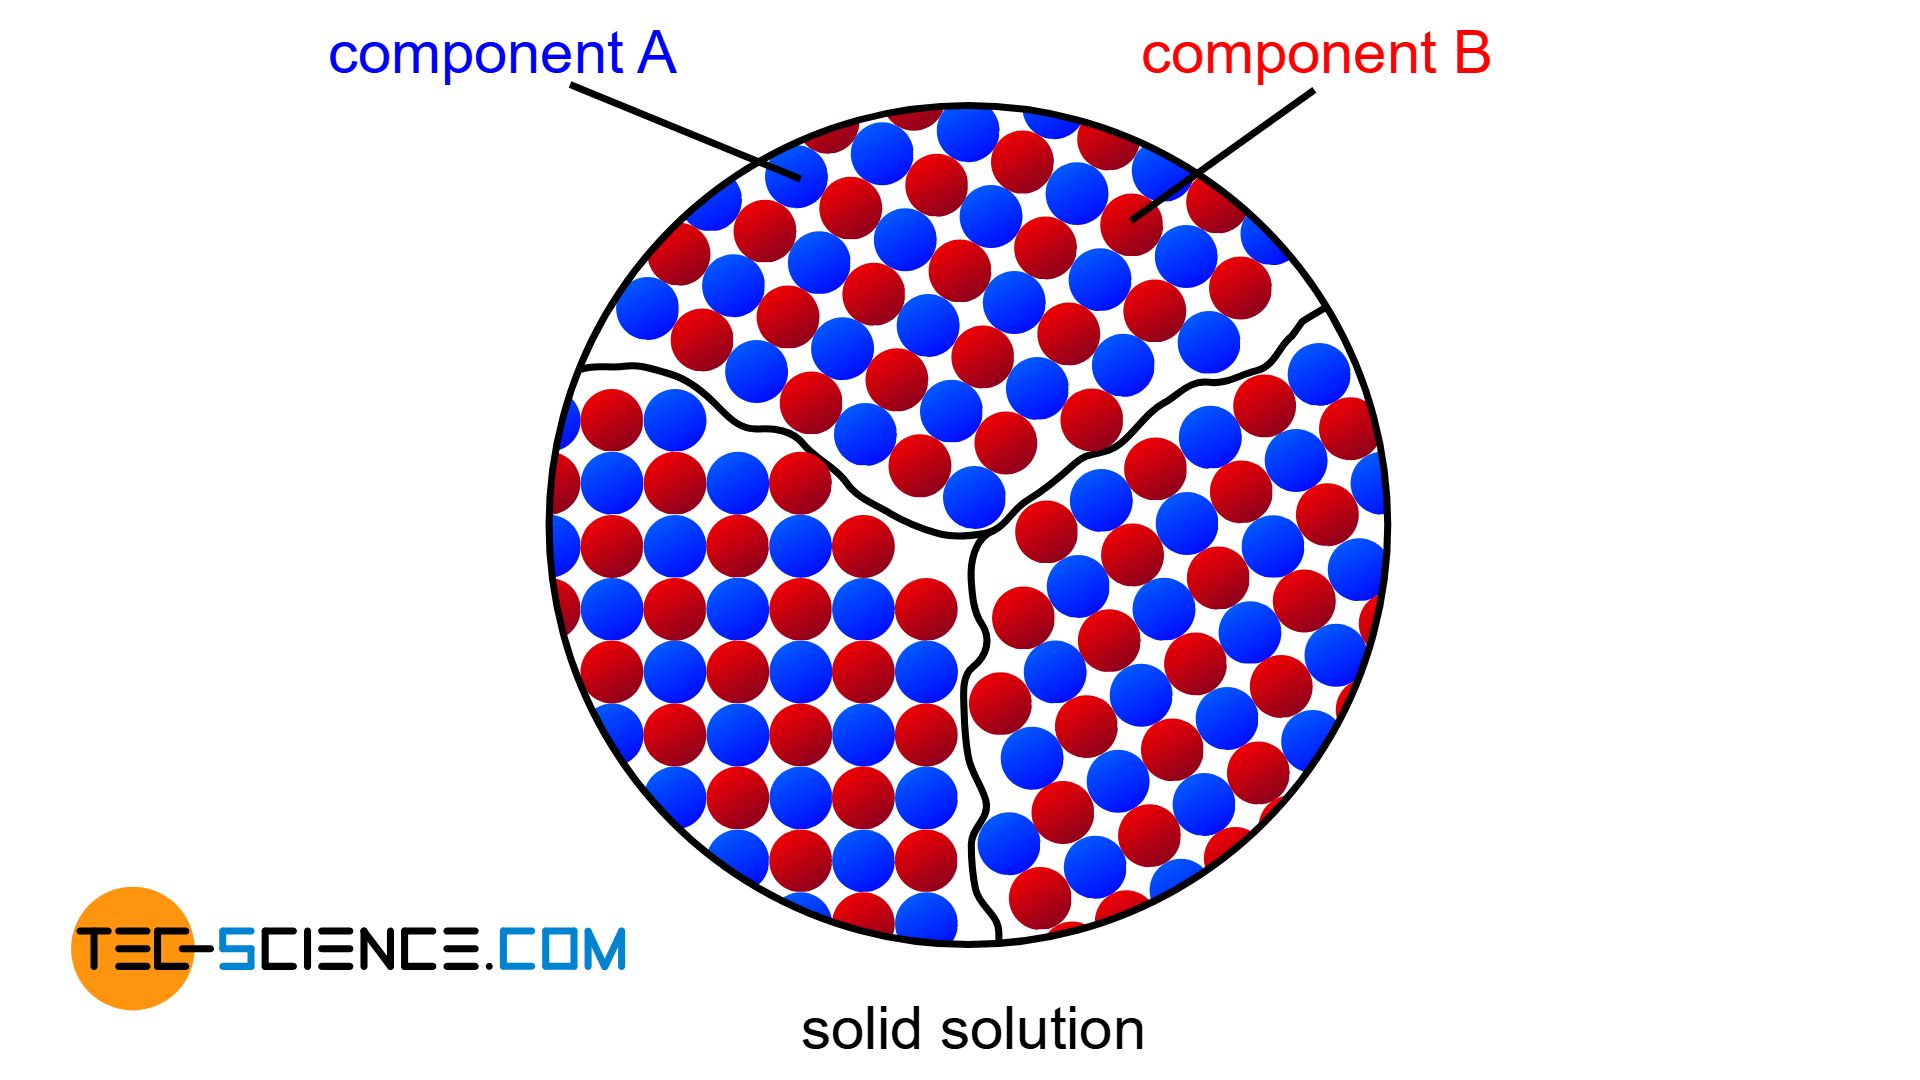
The copper/nickel alloy system exhibits such perfect miscibility over the entire concentration range (complete solid solution series). In the following, therefore, the copper/nickel alloy system will be explained in more detail as an example of an alloy with complete solubility of the components in the solid state.
A complete solubility of the components in the solid state is also called solid solution!
Cooling curves
As already explained in the chapter heat of crystallization, a pure substance solidifies at a so-called thermal arrest, i.e. the temperature remains constant during crystallization. In contrast to this, however, substance mixtures generally no longer have a thermal arrest.
The temperature decrease is no longer stopped completely during crystallization but only slowed down. As shown below, this can be seen in the bent temperature curves for the copper-nickel alloys .
Alloys have no longer a solidification point but a solidification range!
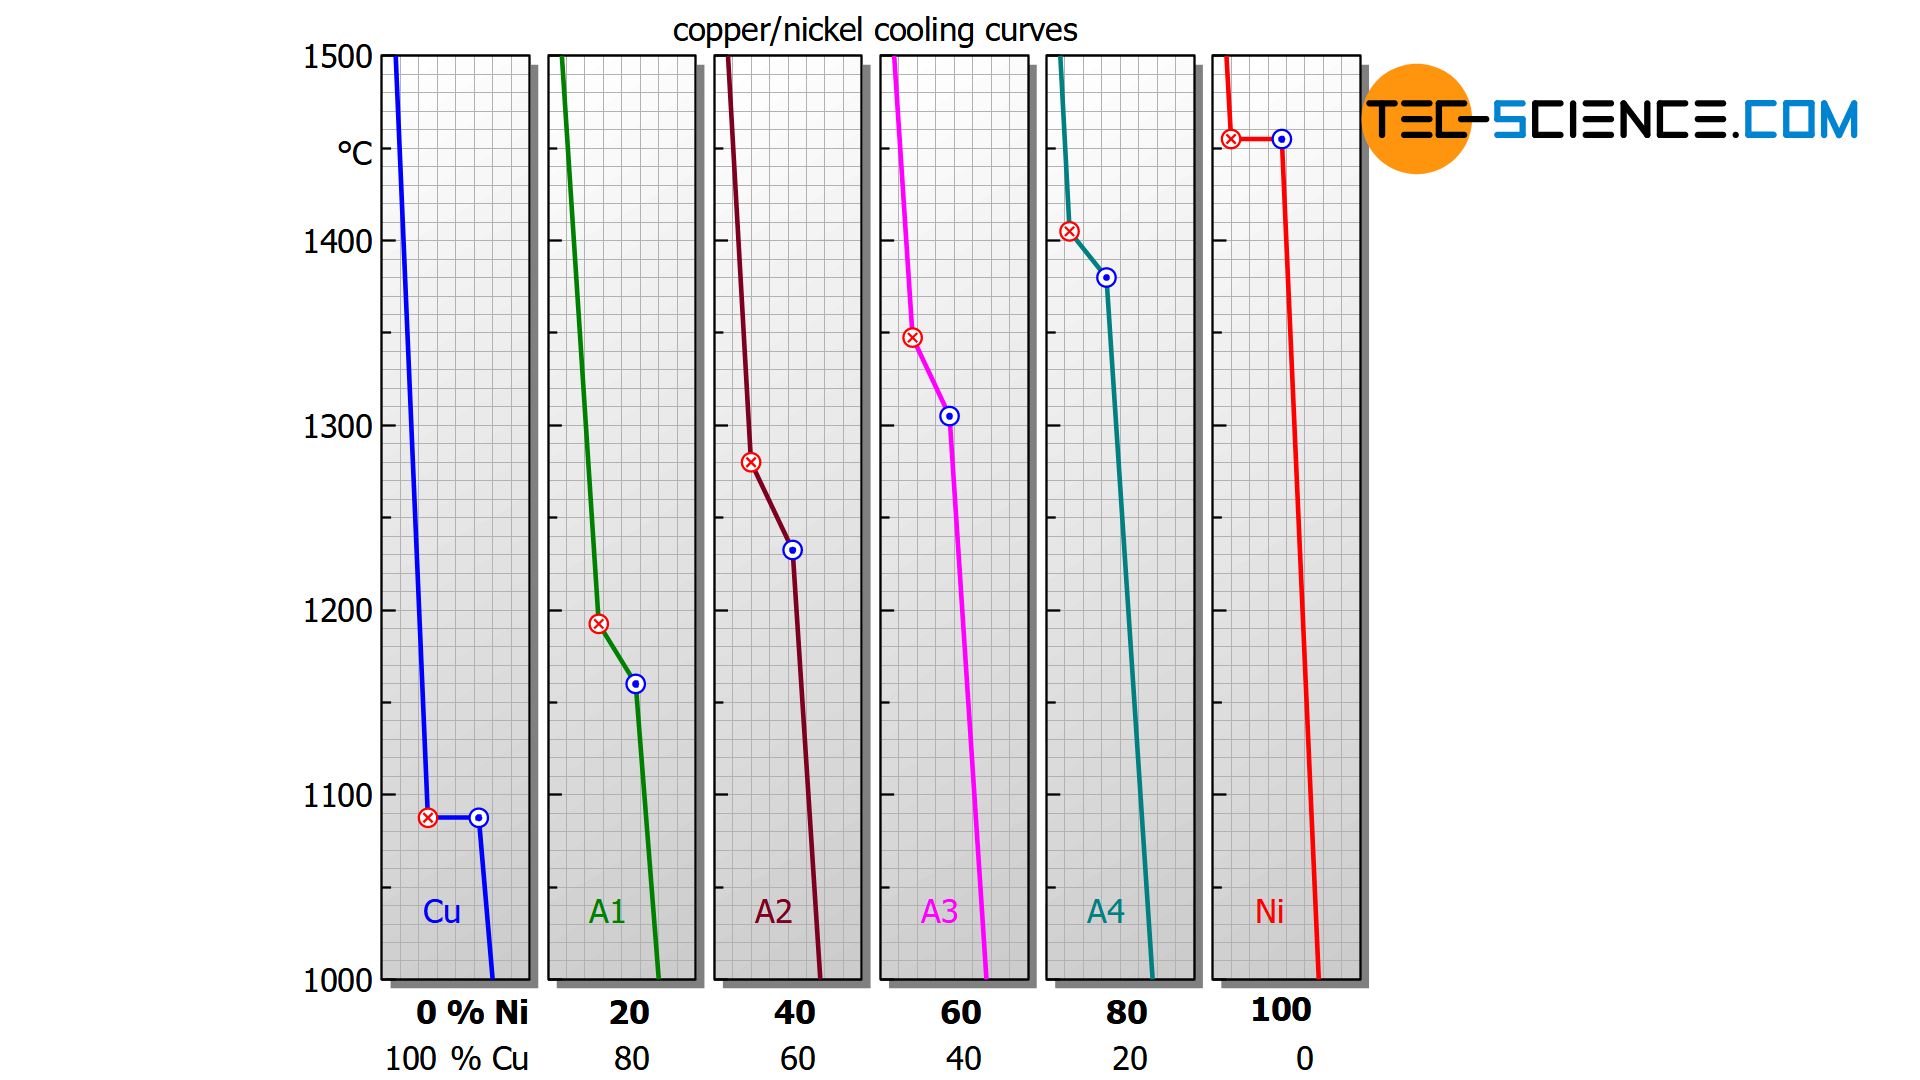
In addition, the cooling curves show that the solidification process extends over different temperature ranges, depending on the nickel content. Starting from the relatively low melting point of pure copper (1085 °C), the solidification range shifts with increasing nickel content to higher values and finally culminates in the solidification point of pure nickel (1455 °C).
For a nickel concentration of 20 %, the alloy solidifies in the temperature range between approx. 1190 °C and 1160 °C, while at a nickel content of 40 %, solidification starts at around 1280 °C and is already finished at around 1230 °C.
The reason for the different solidification ranges is that the presence of the alloying element also changes the chemical properties – such as the solidification temperature.
In principle, alloys can be produced in countless concentration variants, depending on how much of the alloying component is added to the corresponding host material. Accordingly, there is also an innumerable variation in different solidification ranges. To clearly show the solidification ranges across an entire alloy system (i.e. for all conceivable alloy concentrations), so-called phase diagrams are required. Their preparation will be discussed in more detail below.
Phase diagram
How to build up a phase diagram
In order to clearly show the solidification range of alloys as a function of the concentration, a diagram is chosen in which the alloy content is plotted on the horizontal axis in mass percent (here: nickel content) and the temperature is plotted on the vertical axis. Then, for selected cooling curves, the respective start of solidification and the end of solidification are entered in the diagram. In this way, two characteristic lines are obtained which mark the beginning of solidification (liquidus line) and the end of solidification (solidus line) of the entire alloy system.
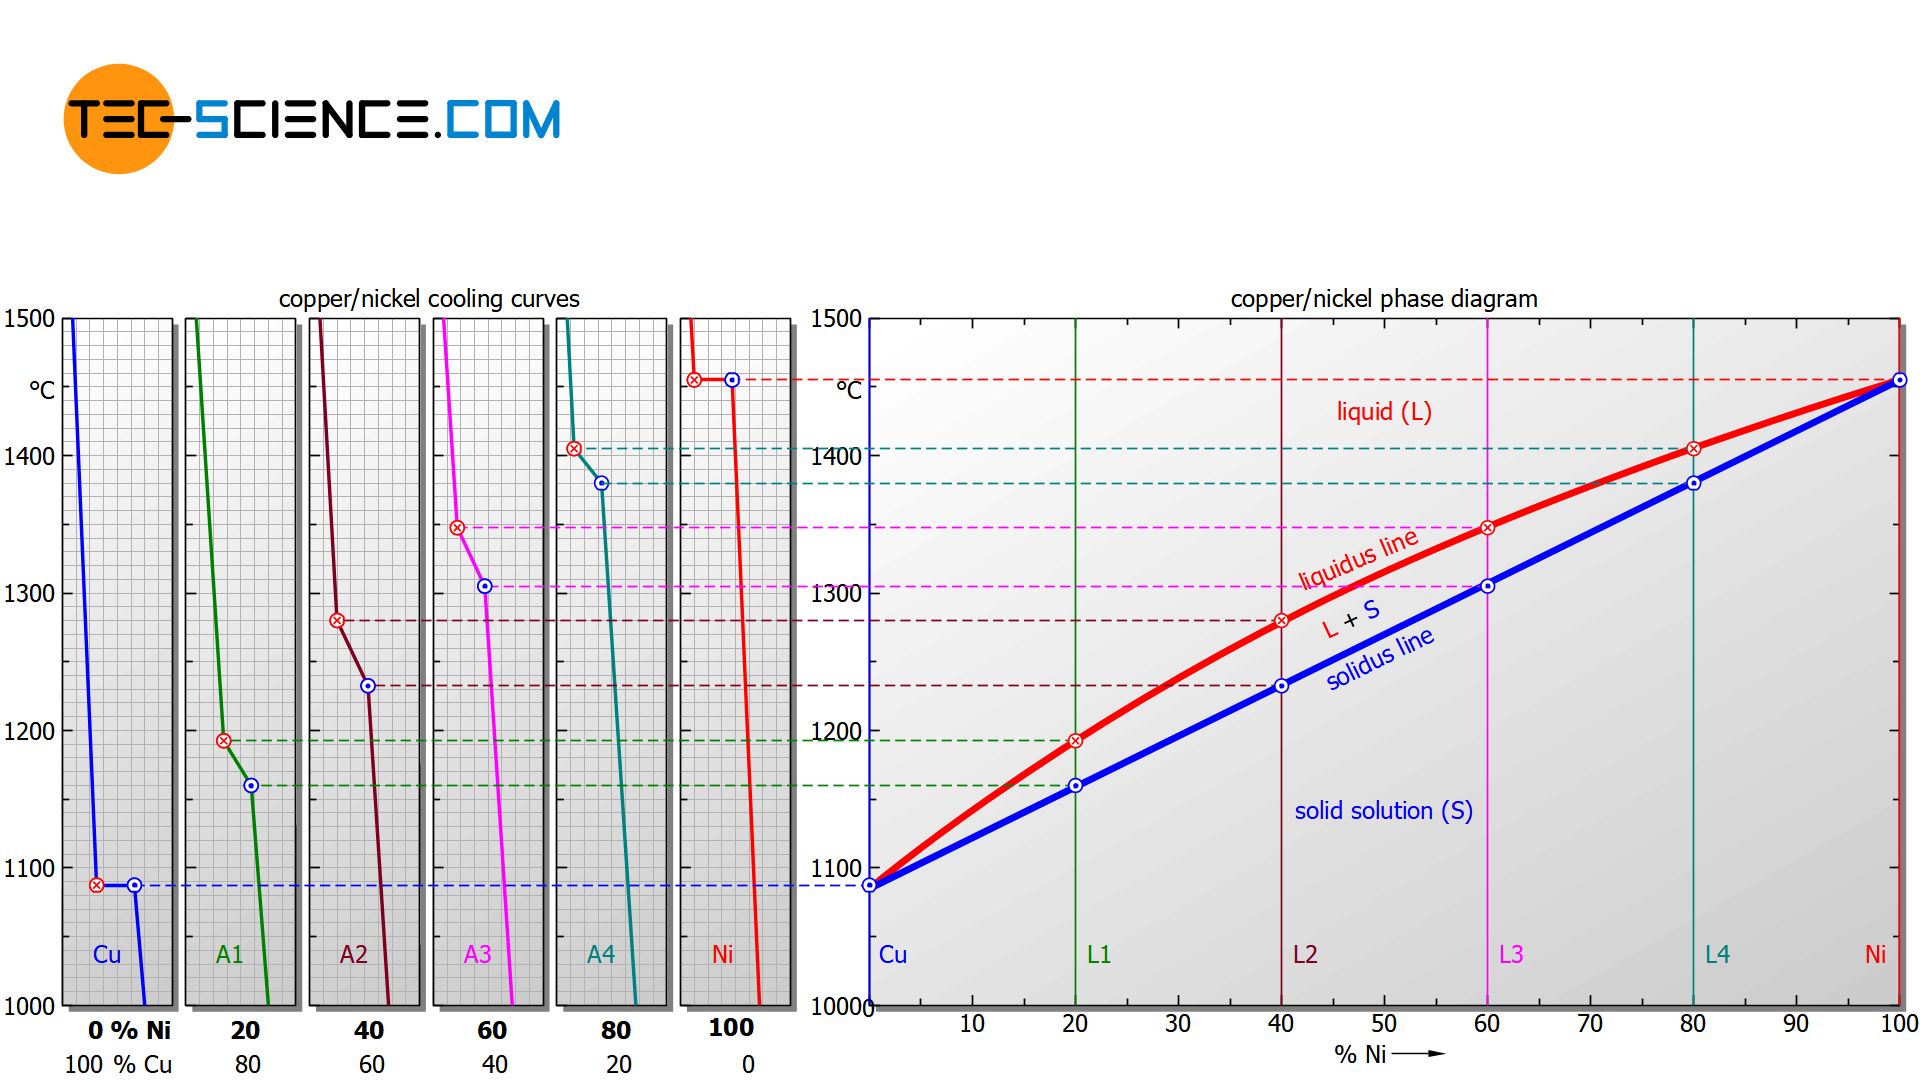
Above the liquidus line the alloy is completely liquid (melt), while below the solidus line the alloy is completely solidified (solid solution)!
Note that the limiting case of a nickel content of 0 % ultimately corresponds to the solidification point of pure copper and a nickel content of 100 % corresponds to that of pure nickel. Since the solidification of these pure substances takes place at a constant temperature, the liquidus line and solidus line coincide there.
Since the thermodynamic states of an alloy become clear in this diagram form, such a concentration-temperature-diagram is also called a state diagram. In addition, the different states are also referred to as phases and the state diagram is therefore often referred to as a phase diagram.
A phase is a state of a substance which is characterized by a uniform chemical and physical structure!
Note that this definition includes not only the different states of matter of a substance, but also its atomic structure. Although diamond and graphite each consist of carbon atoms and both are in the same solid state, the chemical structure is different for diamond and graphite (diamond: diamond lattice, graphite: hexagonal lattice). In this sense, diamond and graphite also represent different phases.
Note that in the region between the liquidus line and the solidus line, two phases coexist – the liquid phase (melt) and the solidified phase (solid solution). This intermediate region is therefore also referred to as a two phase region.
The region between the liquidus line and the solidus line is also referred to as a “two phase region”!
How to read a phase diagram
Using a copper-nickel alloy consisting of 55 % nickel (CuNi55 alloy) as an example, the interpretation of the phase diagram at different temperatures is explained in more detail below.
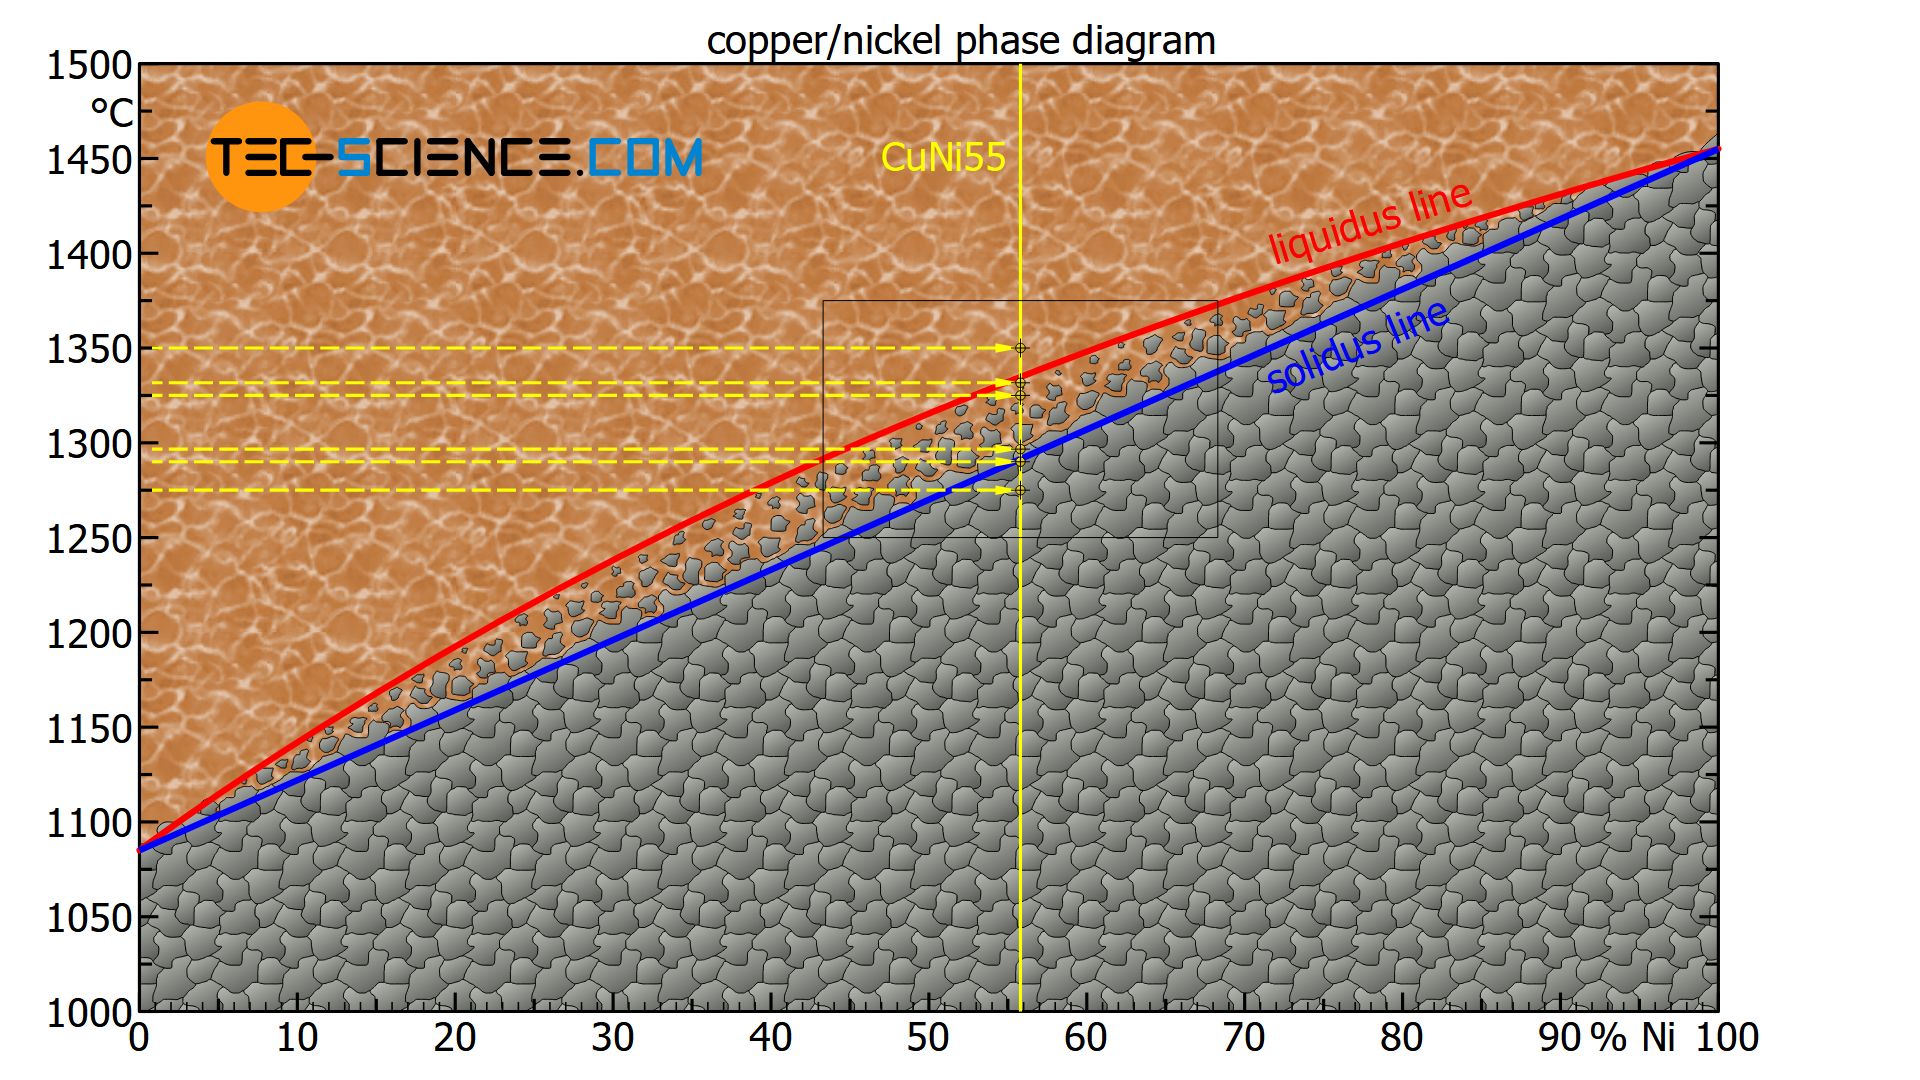
For better orientation, the alloy is first entered into the phase diagram as a line of state (yellow solid line). To locate the corresponding states of the alloy for different temperatures, a horizontal line at the respective temperature (yellow dashed line) is used. The intersection of both lines finally represents the state point, i.e. the state of the alloy at this temperature.
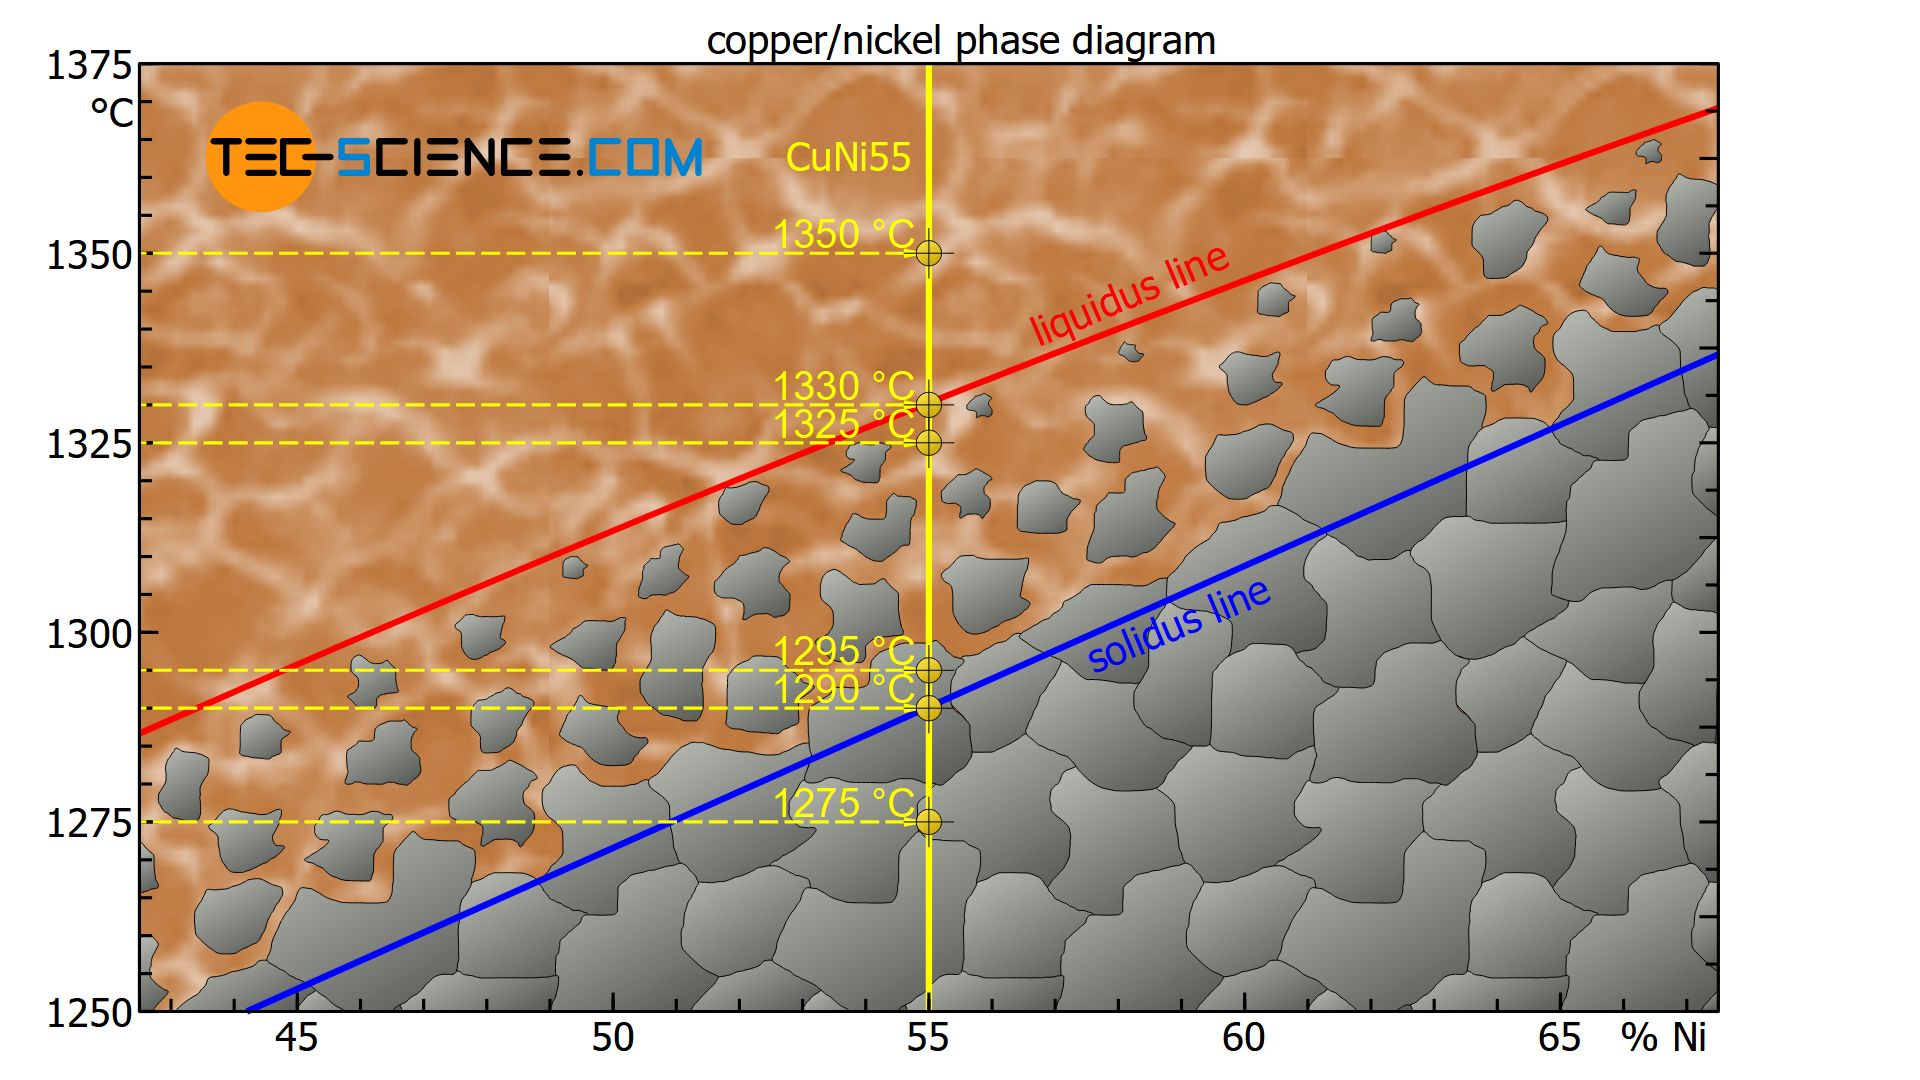
At a temperature of e.g. 1350 °C, the state point of the CuNi55 alloy is above the liquidus line. The alloy is thus completely in a liquid state (melt).
At a temperature of about 1330 °C, the state point is on the liquidus line. The crystallization process starts from existing nuclei and the microstructure begins to form (start of solidification).
At a temperature of 1325 °C, the state point is just below the liquidus line in the two phase region. The solidification process has only just begun and a few crystals have formed, but the majority of the alloy is still liquid.
At a temperature of 1295 °C, the state point is just above the solidus line within the two phase region. The crystallization process is therefore almost complete, so that the crystallites have grown at the expense of the melt, i.e. the microstructure is almost completely solidified.
At a temperature of around 1290 °C the state point of the specified copper-nickel alloy is directly on the solidus line and the microstructure is thus completely solidified.
With further cooling to e.g. 1275 °C the state point is below the solidus line. The microstructure does not change any further. The micrograph shows the typical grains with their grain boundaries.
Scope of validity
Note that the two phases in the two phase region – melt and solid solution – exist stable side by side, i.e. it is a thermodynamically stable state. Although areas that have already solidified may partially liquefy again, at the same time liquid areas crystallize to the same extent to solid components (“mushy state”). This is therefore a thermodynamic equilibrium in which recrystallization processes take place on a microscopic level, but nothing changes on a macroscopic scale.
Since setting a state of equilibrium takes time (by diffusion processes), the cooling curves needed for creating the phase diagram must in principle be recorded at (infinitely) slow cooling. Only then is it always guaranteed that the system is always in thermodynamic equilibrium with the environment. If the cooling rate is too fast, the equilibrium state cannot be reached and the solidification ranges (i.e. liquidus line and solidus line) shift! Strictly speaking, phase diagrams therefore only apply to (infinitely) slow cooling processes. In this respect, the state diagram only shows states in thermodynamic equilibrium (equilibrium diagram).
How to determine the phase composition
During the solidification of an alloy, the chemical composition of both the liquid (melt) and the solid solution changes constantly. The chemical composition of these individual phases is also called phase composition.
The phase composition is the chemical composition of the individual phases (liquid and solid solution)!
One can imagine that the melt is “sieved” from the solid solution crystals that have already solidified. The liquid and the solid are then examined for their chemical composition in separate containers.
Using the example of the already considered CuNi55 alloy, the determination of the phase composition is explained using the state diagram.
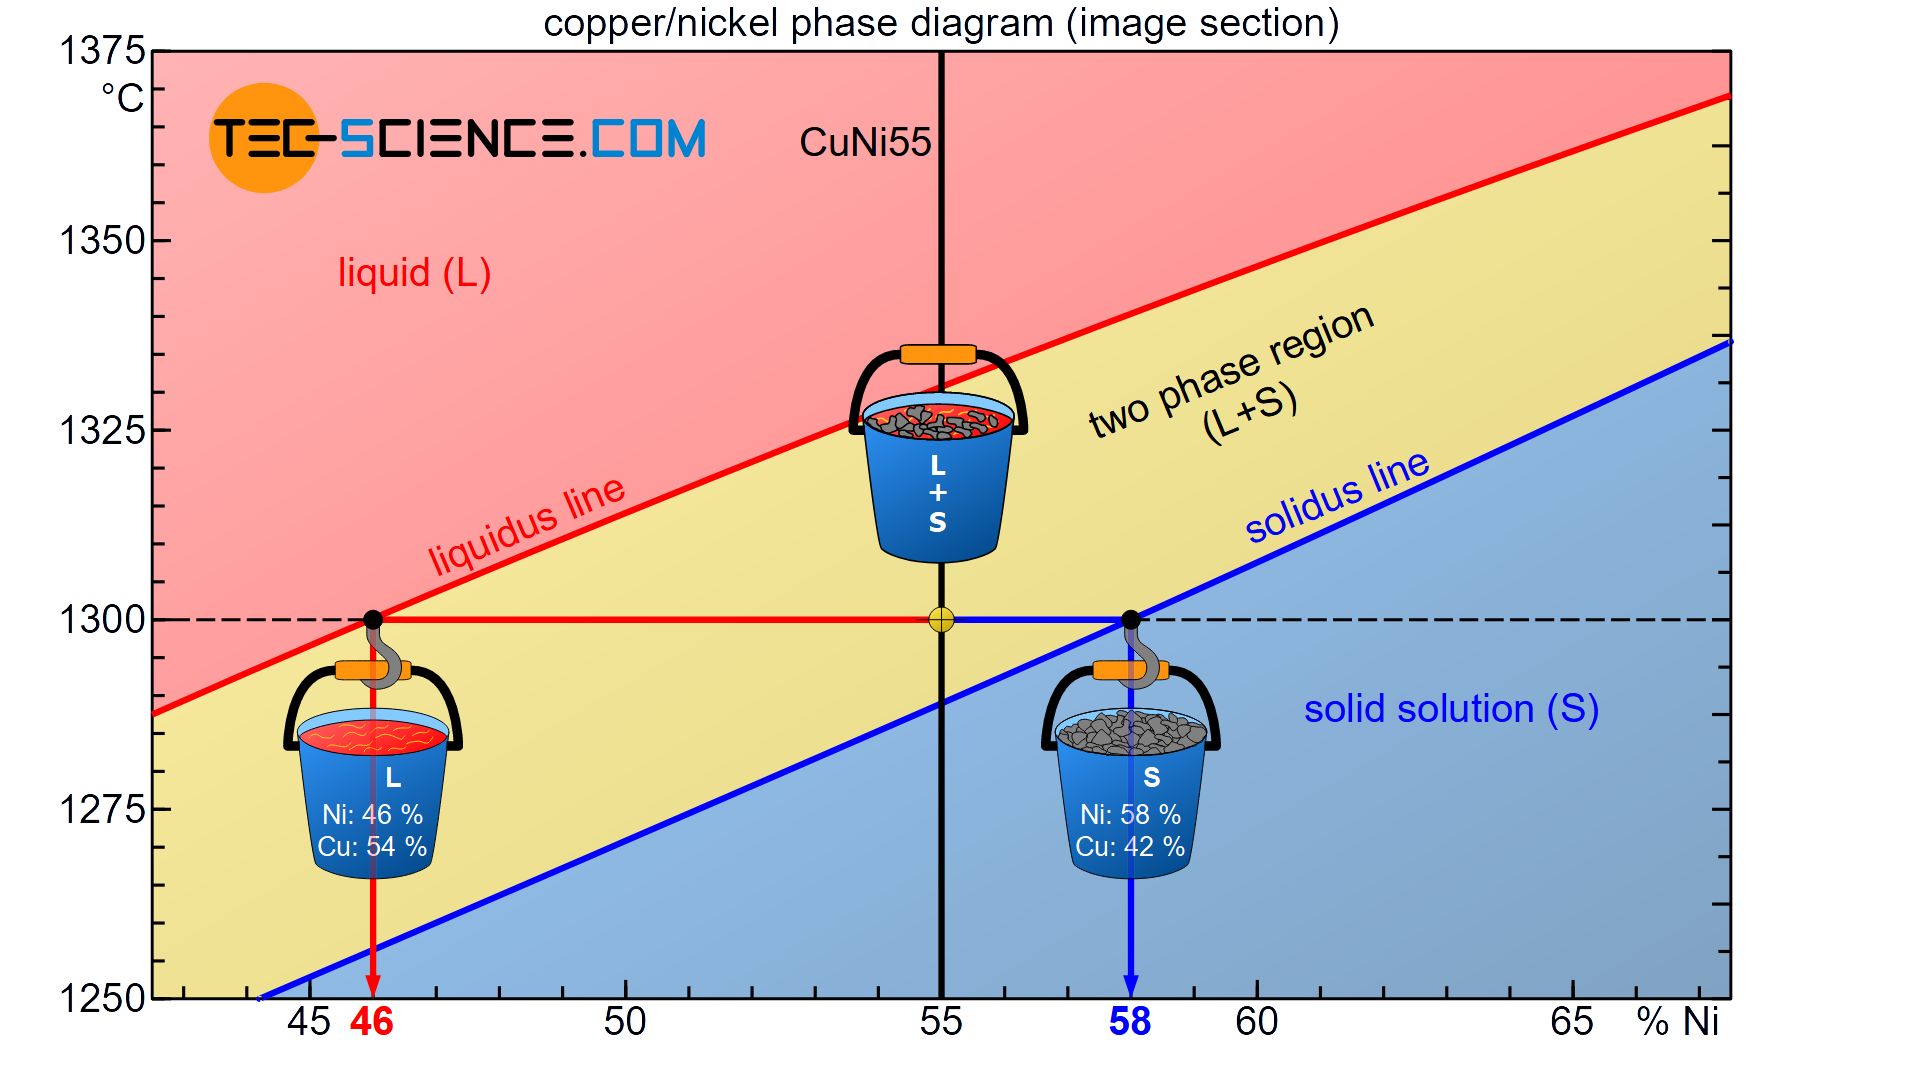
The state of the alloy at a temperature of 1300 °C is considered. This state point lies in the two phase region, so that parts of the alloy are present as melt and solid solution. Both the melt and the solid solution show different chemical compositions. These can be determined as follows.
Starting from the state point, a horizontal temperature line (black dashed line) is drawn until the respective phase boundary is reached (liquidus line or solidus line). This isothermal line between the two phases in the two phase region is also referred to as a tie line.
A tie line is a isothermal line between two phases in a two phase region!
The tie line and the solidus line or liquidus line each mark an intersection. By drawing a vertical line based on the intersection points to the concentration axis, the corresponding chemical composition of the melt and the solid solution can now be read off directly. In this case, the solid solution consists of 58 % Ni (or 42 % Cu) and the remaining liquid melt of 46 % Ni (or 54 % Cu).
Note that the chemical concentrations obtained do not contradict the total alloy concentration of 55% nickel. Although the solid solutions have a higher nickel content (58%) than the alloy itself, the melt has a lower nickel concentration (46%).
For the determination of the total nickel content, the average of both concentrations must not simply be calculated at this point. This consideration would only be justified if the melt and solid solutions were present in equal parts.
However, more solid solution crystals than melt are present in the considered state point. Consequently, the higher nickel concentration of the solid solution with 58 % nickel has a higher weight than the nickel content of the melt. Weighted proportionally, the nickel concentration across the entire alloy would finally return to the required 55%!
How to determine the phase fractions (lever rule)
In the previous section, the determination of the chemical composition of melt and solid solution was explained using the phase diagram. This section deals with the question what percentage of the total alloy is still liquid at a certain temperature (i.e. present as melt) and what percentage is already solidified (i.e. present as solid solution).
For a better understanding, one can imagine that the partially solidified alloy is screened off from the melt. Now the screened solid solution and the remaining melt are weighed separately and their respective mass fractions of the total are determined.
In this context, one also speaks of phase fraction, i.e. the mass fraction between the phases of melt and solid solution. The phase fraction can also be determined using the phase diagram, as explained below.
The phase fraction is the percentage of the respective phases of the total alloy!
Since the converted crystallisation heat is coupled to the respective mass of the phase, the phase fractions can be determined with the lever rule. To explain this, the CuNi55 alloy at a temperature of 1300 °C is again considered.
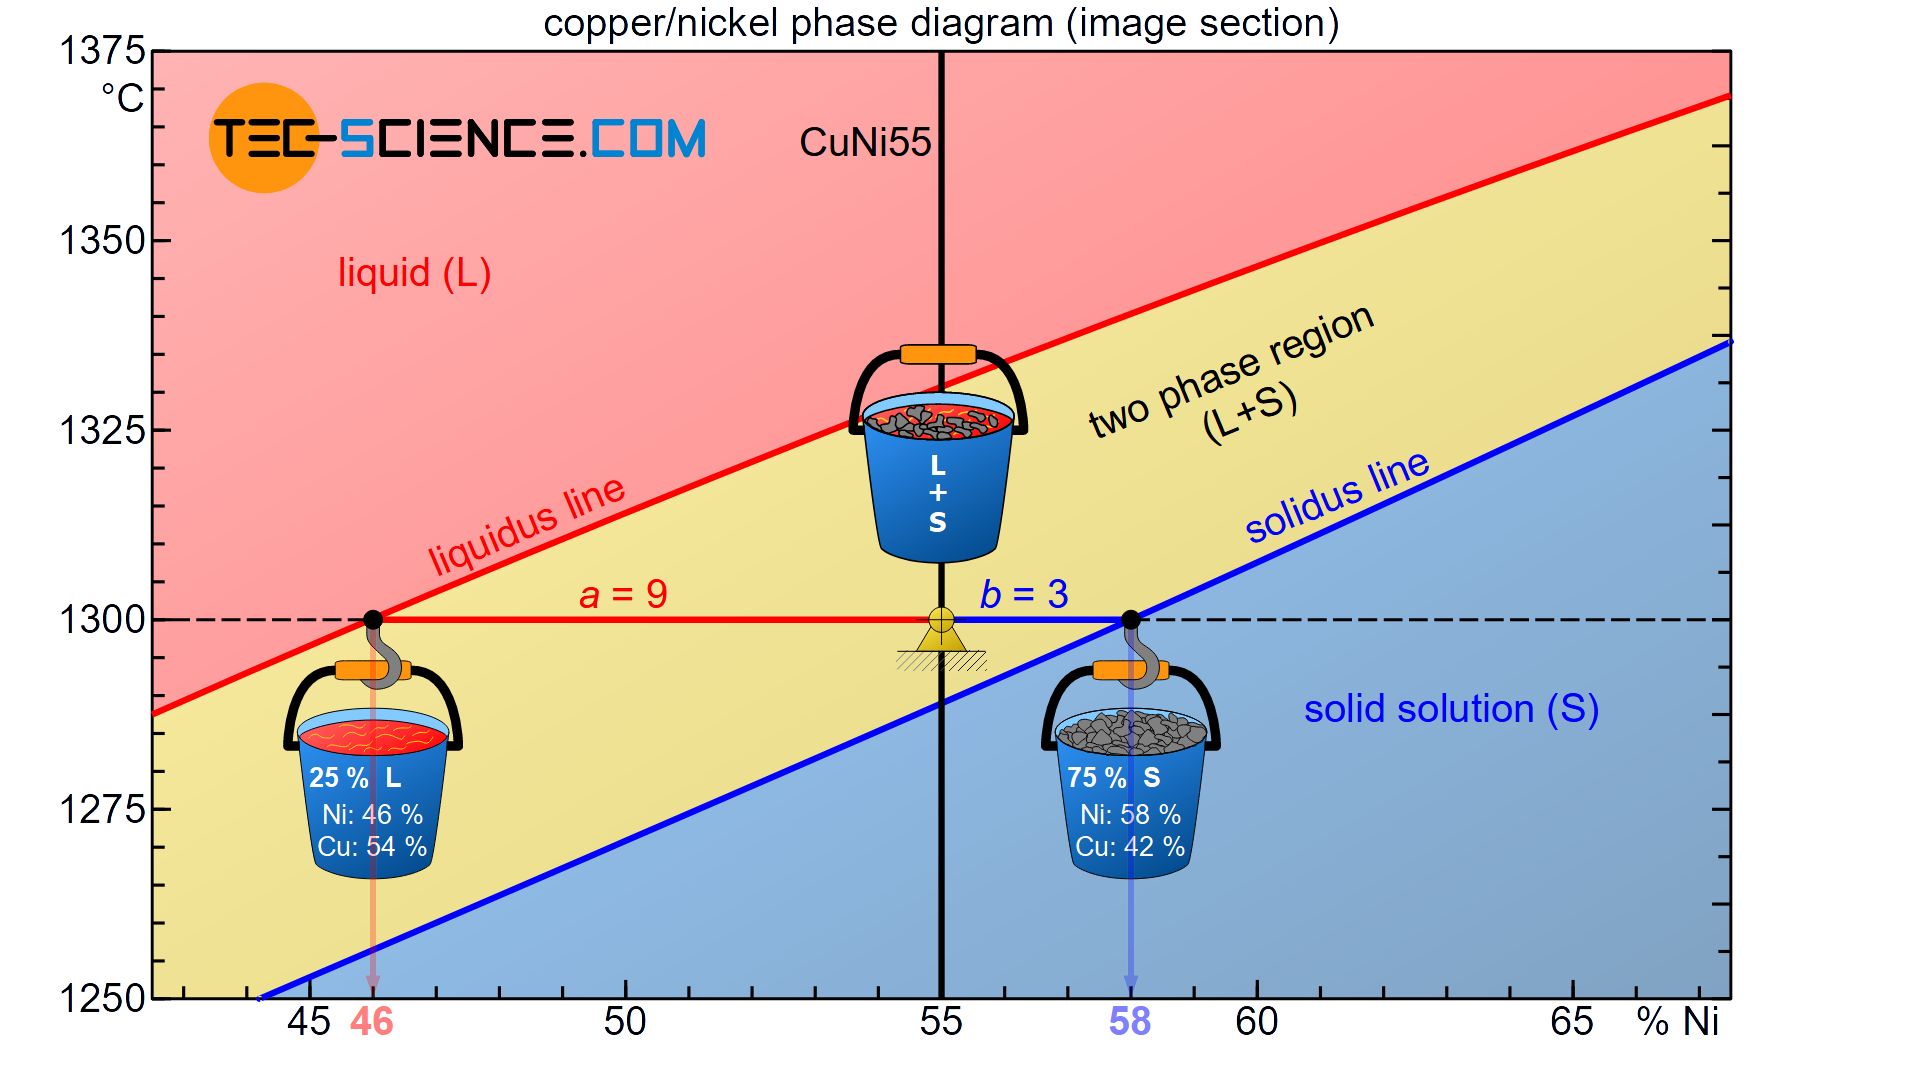
Starting from the considered state point, the corresponding distances to the liquidus line an solidus line form the lever arms of an imaginary balance scale. The fulcrum of this balance scale is in the state point.
Now the respective containers with the sieved phases are attached to the ends of the levers in thought. The container with the solidified solid solutions is suspended at the phase boundary to the solid region (solidus line). The melt container is attached to the liquidus line adjacent to the liquid region.
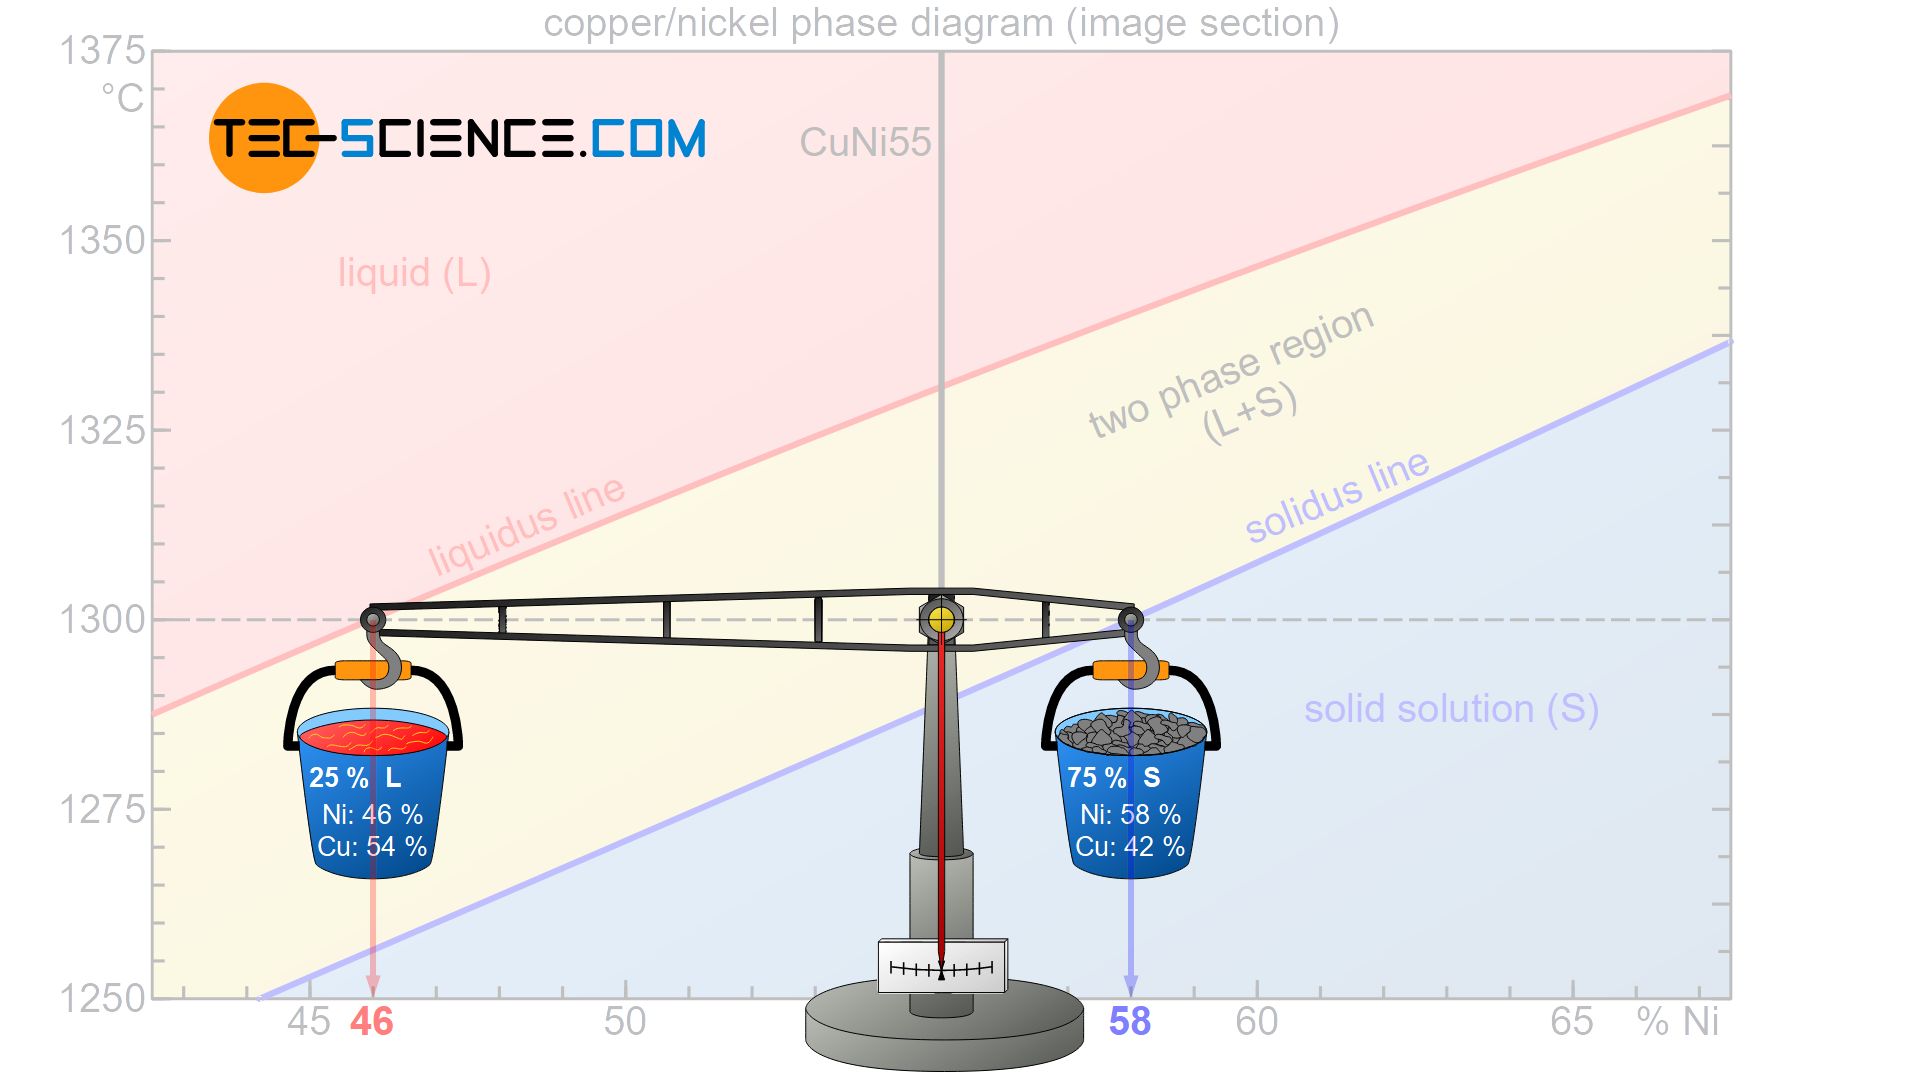
With the condition that the scale has to be balanced, the respective phase fractions can be determined. In a descriptive presentation it will be assumed that the considered alloy have a total mass of 100 kg. In this context, the question arises how much of this total mass is allocated to the respective lever arms in order to be in equilibrium.
If the mass of the liquid melt is denoted by \(L\) and the mass of the solid solution by \(S\), the lever rule first provides the following relationship with the corresponding lever arms \(a\) and \(b\):
\begin{align}
\label{hebelgesetz}
& L \cdot a = S \cdot b \\[5px]
\end{align}
A further condition is that the mass fraction of melt and solid solution must add up to 100 % (in the descriptive presentation this corresponds to the use of 100 kg alloy mass):
\begin{align}
\label{massengesetz}
& L + S = 100 \text{ %} \\[5px]
\end{align}
The two equations can now be inserted into each other and solved for the values \(L\) or \(S\):
\begin{align}
\underline{L\cdot a = S \cdot b} ~~~\text{and}~~~\underline{S = 100 \text{ %} -L} ~~~\text{:} \\[5px]
\end{align}
\begin{align}
L \cdot a &= (100 \text{ %} – L) \cdot b \\[5px]
L \cdot a &= 100 \text{ %} \cdot b – L \cdot b \\[5px]
L \cdot a + L \cdot b &= 100 \text{ %} \cdot b \\[5px]
L \cdot (a+b) &= 100 \text{ %} \cdot b \\[5px]
\end{align}
\begin{align}
\label{Sm}
\boxed{L = \frac{b}{a+b} \cdot 100 \text{ %}} \\[5px]
\end{align}
The phase fraction of the solid solution is obtained in the same way:
\begin{align}
\underline{L \cdot a = S \cdot b} ~~~\text{and}~~~\underline{L = 100 \text{ %} -S} ~~~\text{:} \\[5px]
\end{align}
\begin{align}
(100 \text{ %} – S) \cdot a &= S \cdot b \\[5px]
100 \text{ %} \cdot a – S \cdot a &= S \cdot b \\[5px]
100 \text{ %} \cdot a &= S \cdot b + S \cdot a \\[5px]
100 \text{ %} \cdot a &= S \cdot (a+b) \\[5px]
\end{align}
\begin{align}
\label{Mk}
\boxed{S = \frac{a}{a+b} \cdot 100 \text{ %}} \\[5px]
\end{align}
Finally, the results can be interpreted as follows. The fraction of a phase is always determined by the length of the opposite lever arm divided by the total length of the tie line!
The phase fraction is calculated by the length of the opposite lever arm divided by the total length of the tie line (lever rule)!
This is much more memorable than the corresponding formulas, especially since the names of the lever arms \(a\) and \(b\) were chosen arbitrarily and the respective formulas would also change if they were mixed up.
In the present case, the opposite lever arm of the solid solution container has \(a=9\) and the opposite lever length of the melt container \(b=3\) (where the lever lengths refer to the distance of the respective concentration values). This results in a total length of \(a+b=12\). These values can now be used to determine the phase fraction of the melt and solid solution:
\begin{align}
\underline{L} = \frac{b}{a+b} \cdot 100 \text{ %} = \frac{3}{12} \cdot 100 \text{ %} = \underline{25 \text{ %}} \\[5px]
\underline{S} = \frac{a}{a+b} \cdot 100 \text{ %} = \frac{9}{12} \cdot 100 \text{ %} = \underline{75 \text{ %}} \\[5px]
\end{align}
Accordingly 25 % of the total alloy mass is present as melt, while the remaining 75 % of the alloy is already solidified and thus present as solid solution. Of course, the sum of the phase fractions must add up to 100 %. Note that as the temperature drops, the balance continuously shifts towards a larger fraction of solid solution, which also shows that the microstructure is solidifying more and more.
In order to make the figures calculated somewhat clearer, a total alloy mass of 100 kg is assumed. Then 75 kg of the alloy are already solidified, while 25 kg are still in liquid form. As already determined in the section of phase composition, the 75 kg of solid solution consist on average of 58 % nickel, while the 25 kg of melt has a nickel content of 45 %.
The solid solution thus contains a nickel mass of 43.5 kg (=75 kg x 0.58) and in the melt a nickel mass of 11.5 kg (=25 kg x 0.46). In total, the alloy thus contains a nickel mass of 55 kg (=43.5 kg + 11.5 kg). This corresponds exactly to the mass of nickel needed for a CuNi55 alloy.
Crystal segregation
If a copper-nickel alloy is solidified, a subsequent material test often reveals that the nickel content within a grain can differ greatly from region to region. While the grain center is characterized by a relatively high nickel content, the edge areas of the grain, for example, are rather low in nickel. Such concentration differences within a grain are called crystal segregations or microsegregation.
Crystal Segregations are differences in the chemical composition within a grain!
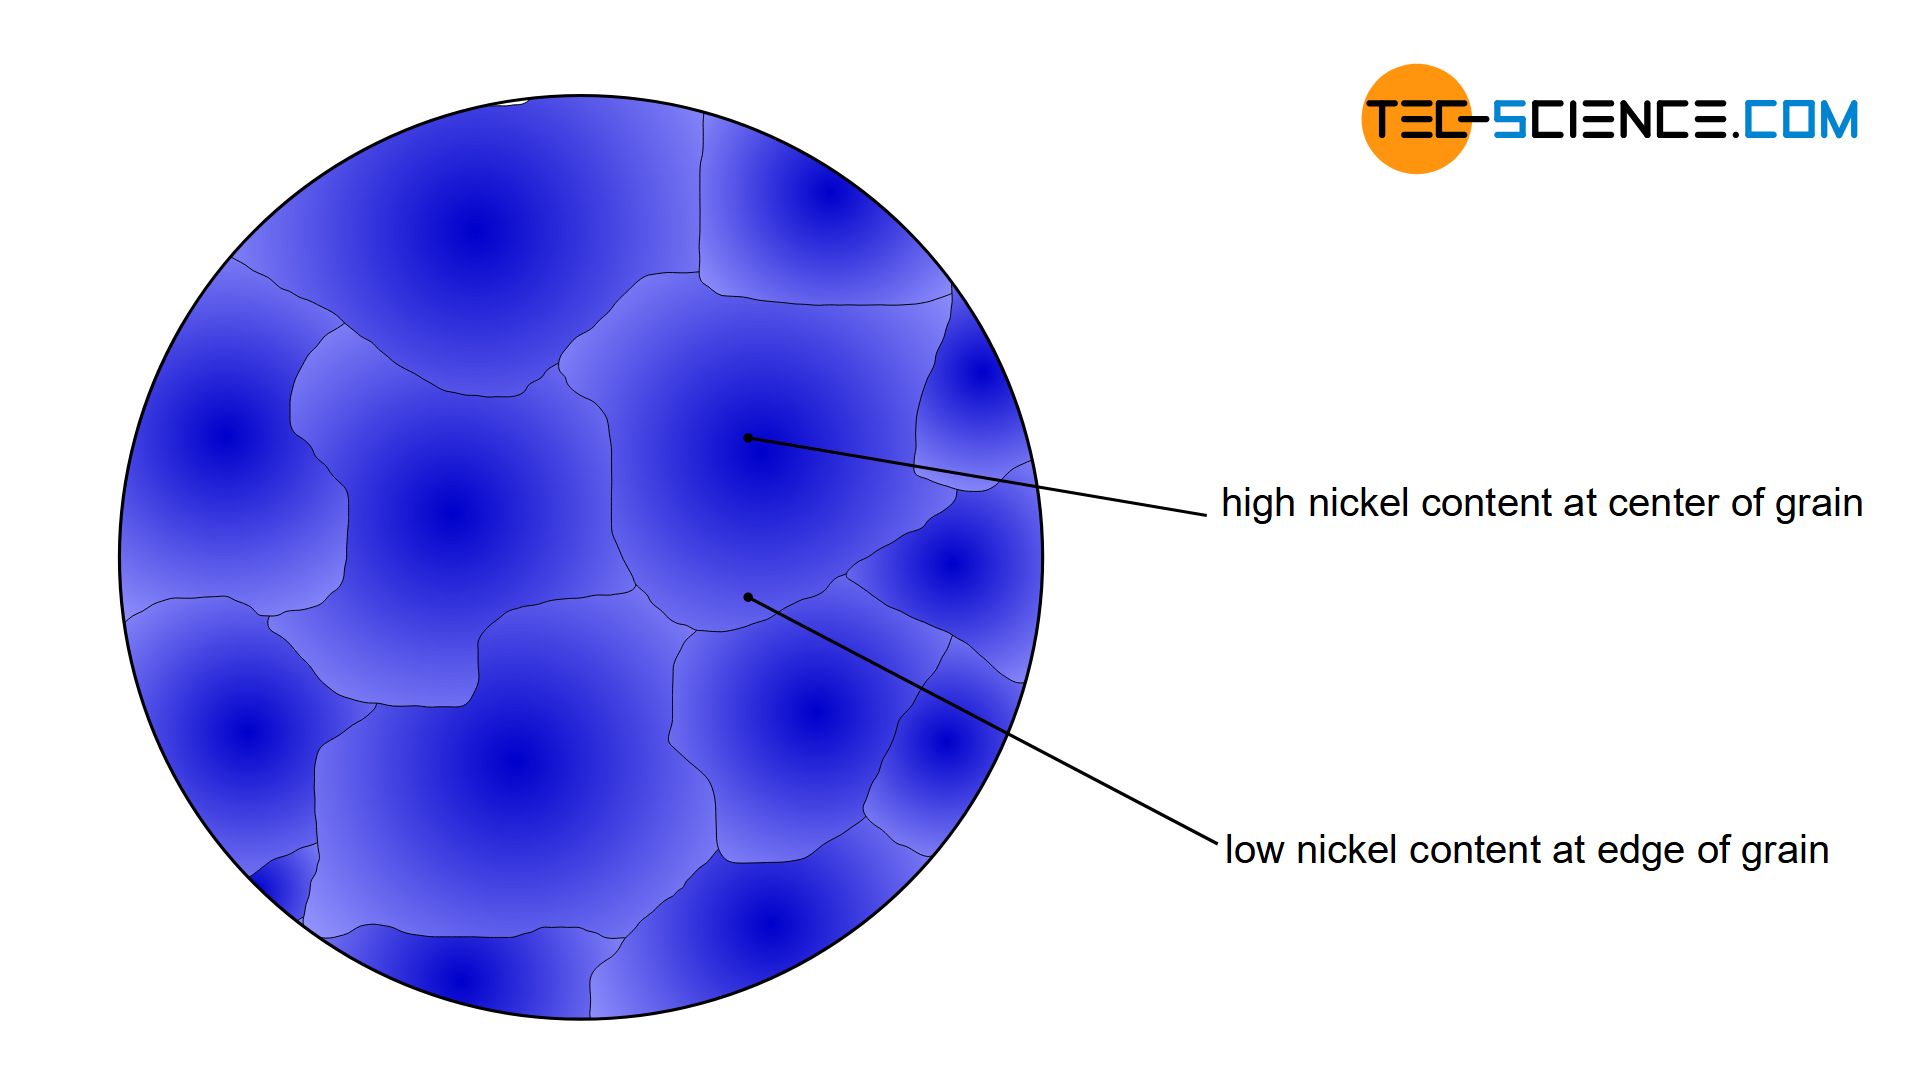
However, since the alloy concentration has a decisive influence on the material properties, the grain centre thus shows a different property (e.g. harder) than the edge area (e.g. softer). Such different properties within a grain are generally not desired, as this can lead to unpredictable material failure.
The formation of crystal segregations is relatively easy to understand with the help of the rules explained in the section of phase composition. In order to explain the formation of crystal segregations, a CuNi55 alloy with 55 % nickel is considered.
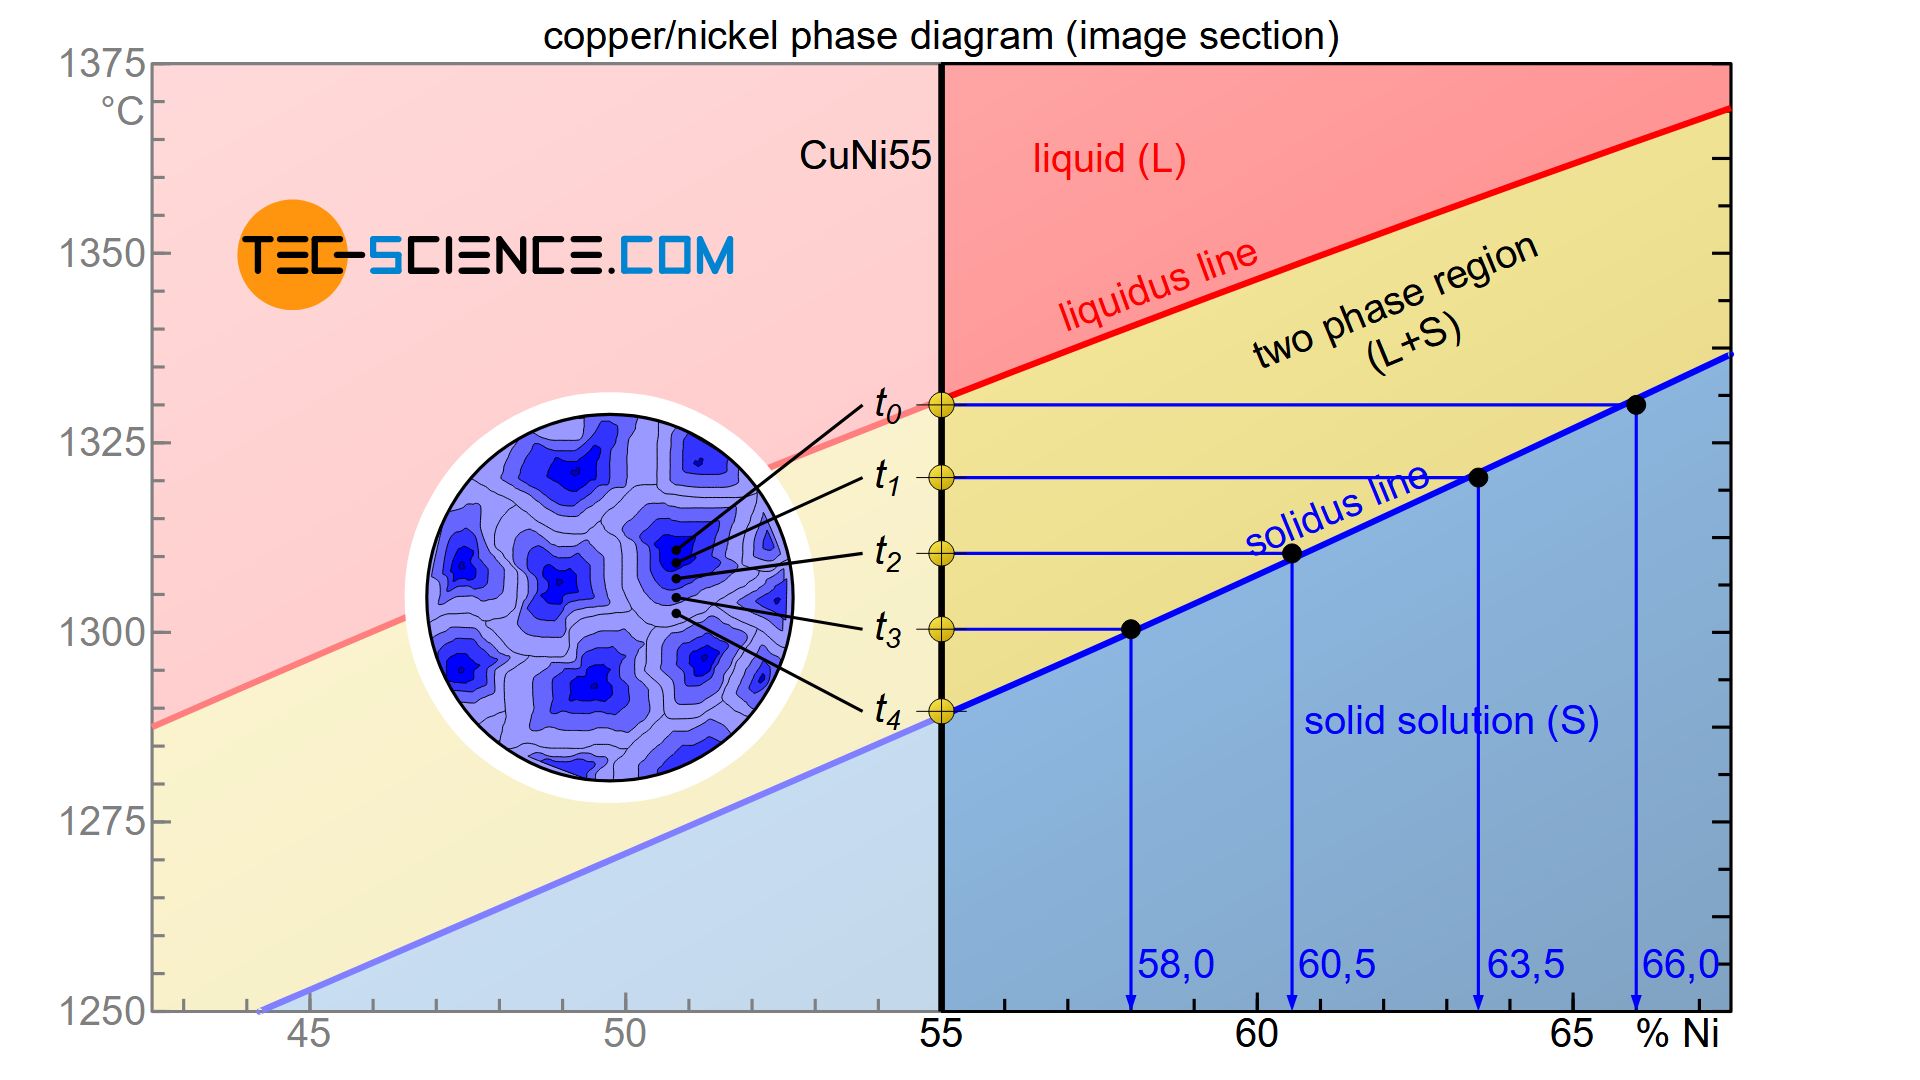
The phase diagram shows that during solidification, the nickel concentration within the resulting solid solution decreases over time. The first solid solution formed, has a nickel content of around 66 % immediately upon the onset of solidification at the time \(t_0\).
As the cooling progresses, additional atoms from the melt accumulate around the crystals that have already formed. At a later point in time \(t_1\), a new layer has finally accumulated, which according to the phase diagram leads to an average nickel content in the entire grain of only 63.5 %. Since this is an average value within the entire solid solution, the deposited layer must obviously have a lower nickel content than the previously solidified layer. This is the only way to explain the drop in the average nickel content.
Finally, as solidification progresses, the mean nickel content in the solid solution decreases further (\(t_1\)→\(t_2\)→\(t_3\)). If the solidification process is completed at the time \(t_4\), the nickel content has finally dropped to 55 % and is now completely in the solidified microstructure.
In reality, the atomic layers are not deposited gradually but continuously around the solidified crystals. Consequently, a continuous decrease of nickel concentration is obtained starting from the grain centre (start of solidification) up to the corresponding edge areas (end of solidification). This is how the formation of crystal segregations can be explained.
Note that crystal segregation is not a phenomenon of copper-nickel alloys, but a fundamental phenomenon of solid solutions!
In principle, crystal segregation could be avoided by a sufficiently slow cooling, as the resulting differences in concentration can always be compensated by diffusion processes. In reality, however, cooling processes cannot take place infinitely slowly, which inevitably results in differences in concentration in the microstructure. In such cases, the resulting differences in concentration can be partially compensated by subsequent heat treatment at sufficiently high temperatures (called diffusion annealing).


