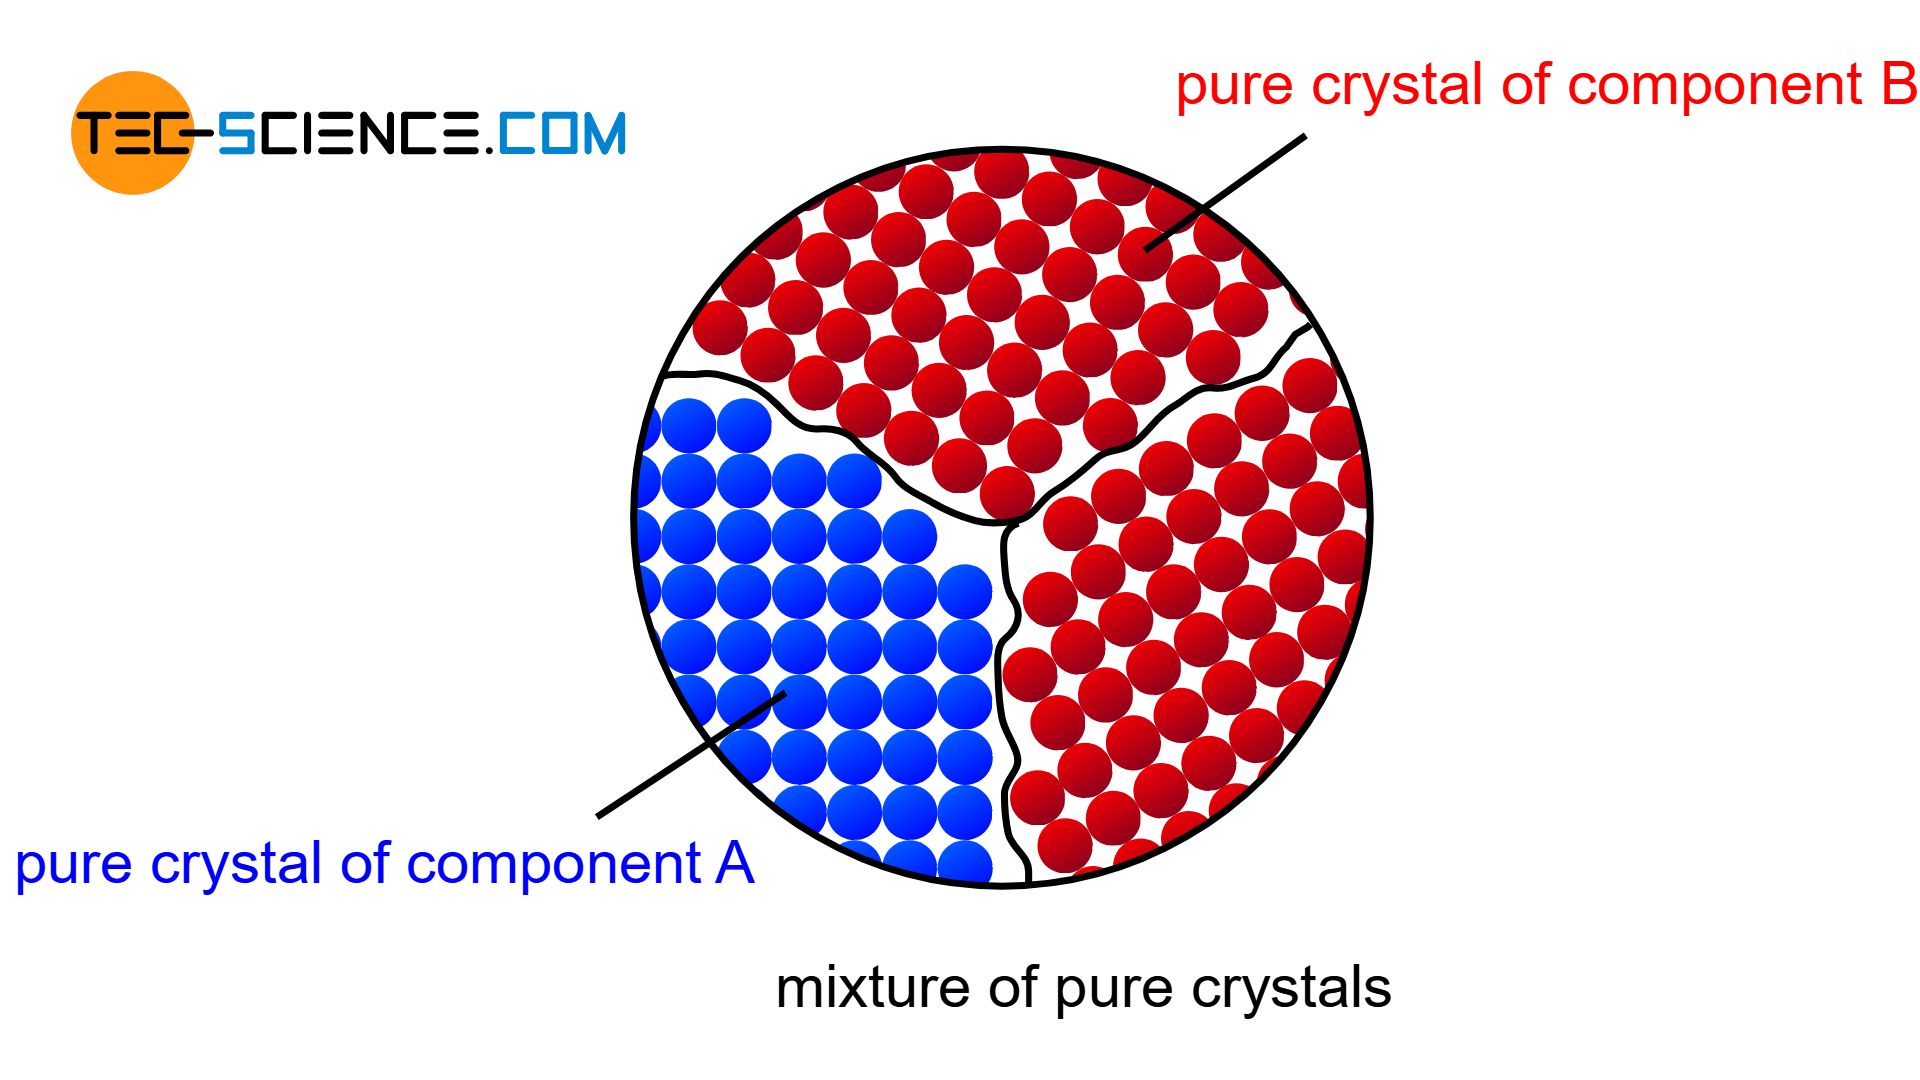
If the components of an alloy are completely insoluble in each other in the solid state, then a mixture of pure crystals is formed.
Introduction
If the two components of a binary alloy system are completely insoluble in one another in the solid state, one speaks of a crystal mixture. In this case, each of the two components forms its own crystal lattice structure. The individual crystals are only composed of the atoms of the corresponding substance, i.e. they are pure crystals. Hence the term “crystal mixture”.
The bismuth/cadmium alloy system exhibits such a complete insolubility of the components in the solid state over almost the entire mixing range. Therefore, this alloy system will be explained in more detail below.
A complete insolubility of the components in the solid state will lead to a mixture of pure crystals!
Cooling curves
The cooling curves of insoluble components (accounts only for the solid state, not in the liquid state!) show a flattening during solidification as well as a thermal arrest. While the beginning of the flattening indicates the start of solidification, the solidification ends after the thermal arrest. Depending on the concentration of the alloying element, the solidification starts at different temperatures. The end of solidification, on the other hand, always takes place in a thermal arrest at the same temperature, irrespective of the alloy concentration!
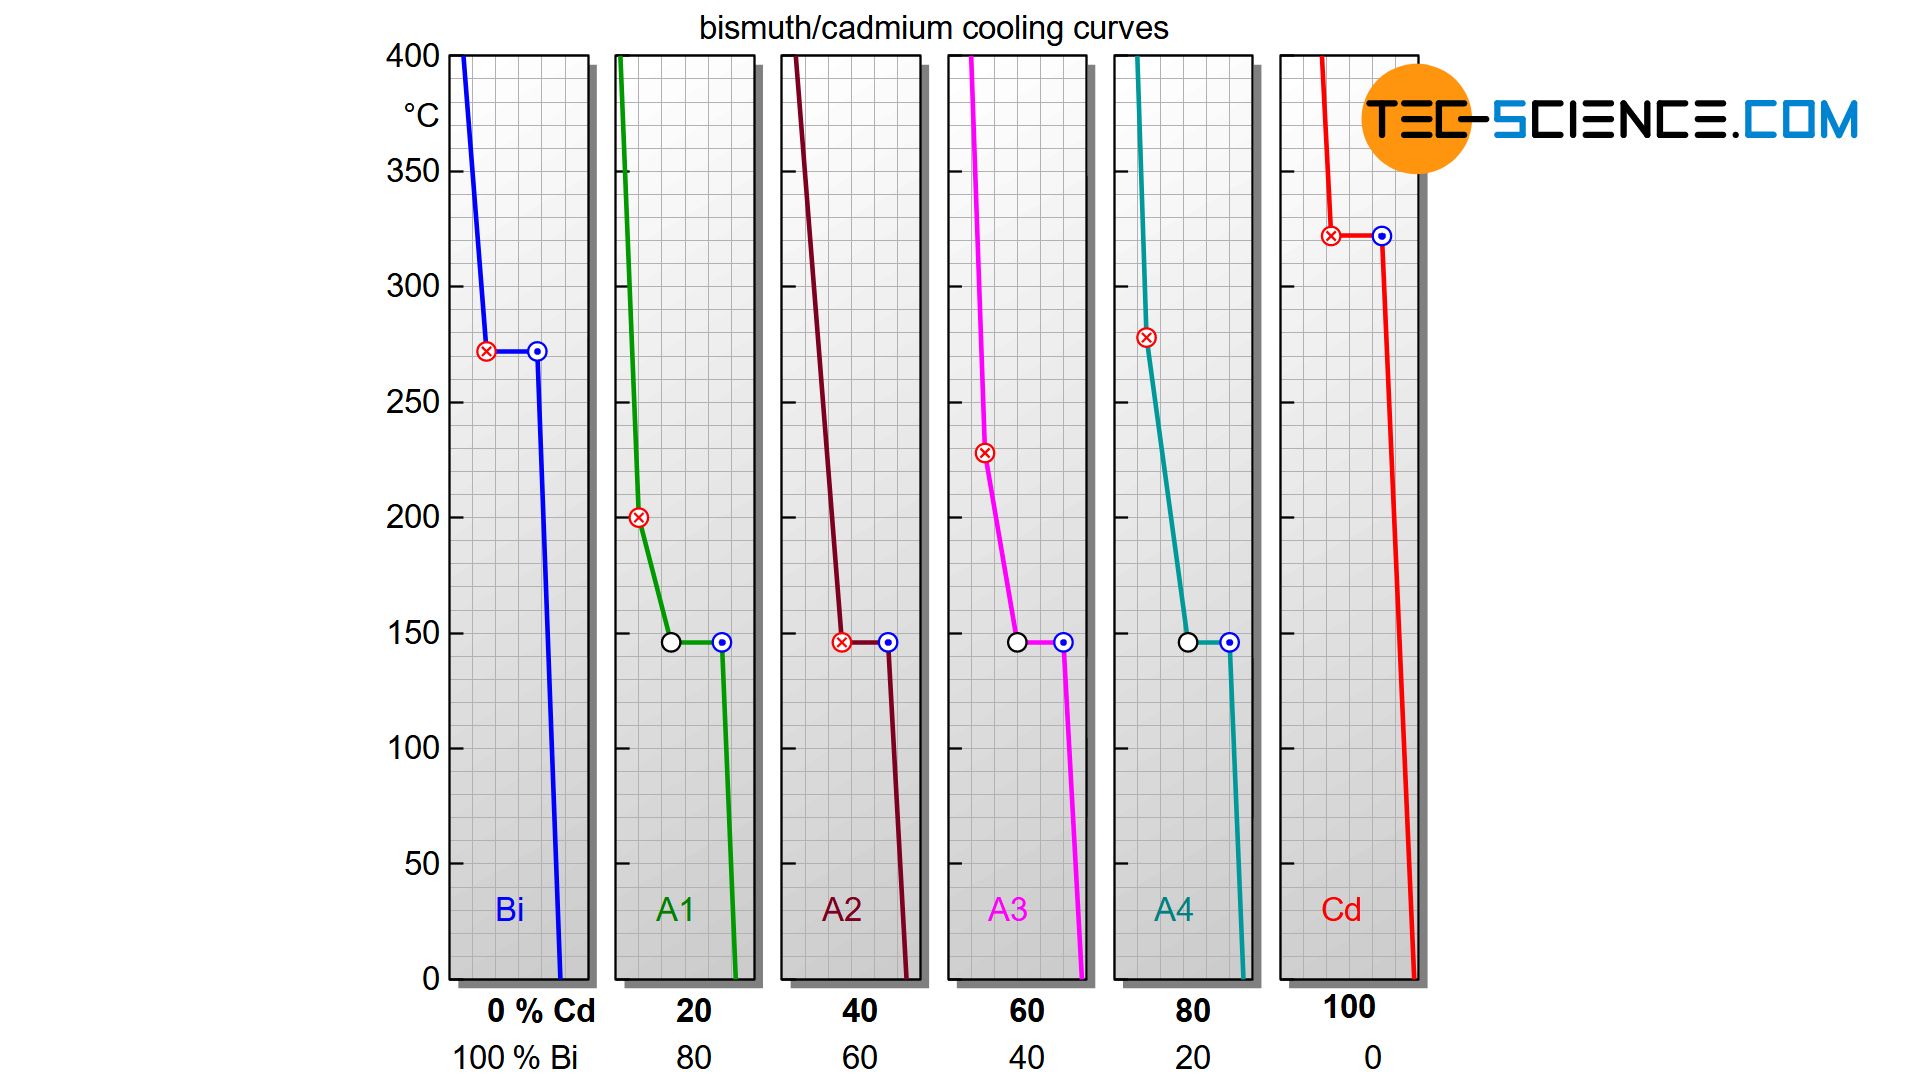
Alloys, whose components are completely insoluble in one another, solidify in a temperature range, whereby the solidification is always finished at the same temperature (thermal arrest)!
Starting with pure bismuth, the start of solidification is shifted more and more towards lower temperatures as the cadmium content increases. At an alloy concentration of 40 % cadmium, the start of solidification has fallen so far that it even coincides with the thermal arrest. This special alloy solidifies like a pure substance with only a thermal arrest (eutectic alloy). If the cadmium concentration is increased further, the start of solidification shifts back to higher temperatures and finally ends at the solidification temperature of the pure cadmium.
In order to clearly show the different solidification ranges as a function of the alloy composition, a phase diagram can be generated at this point. Its creation will be discussed in more detail in the next section.
Phase diagram
How to build up a phase diagram
The phase diagram in this case is generated analogous to that of a solid solution. For this purpose, the start of solidification and the end of solidification are transferred from selected cooling curves into a concentration-temperature diagram. One gets again two characteristic lines. The upper polylines mark the beginning of solidification (liquidus line) and the lower horizontal line the end of solidification (solidus line).
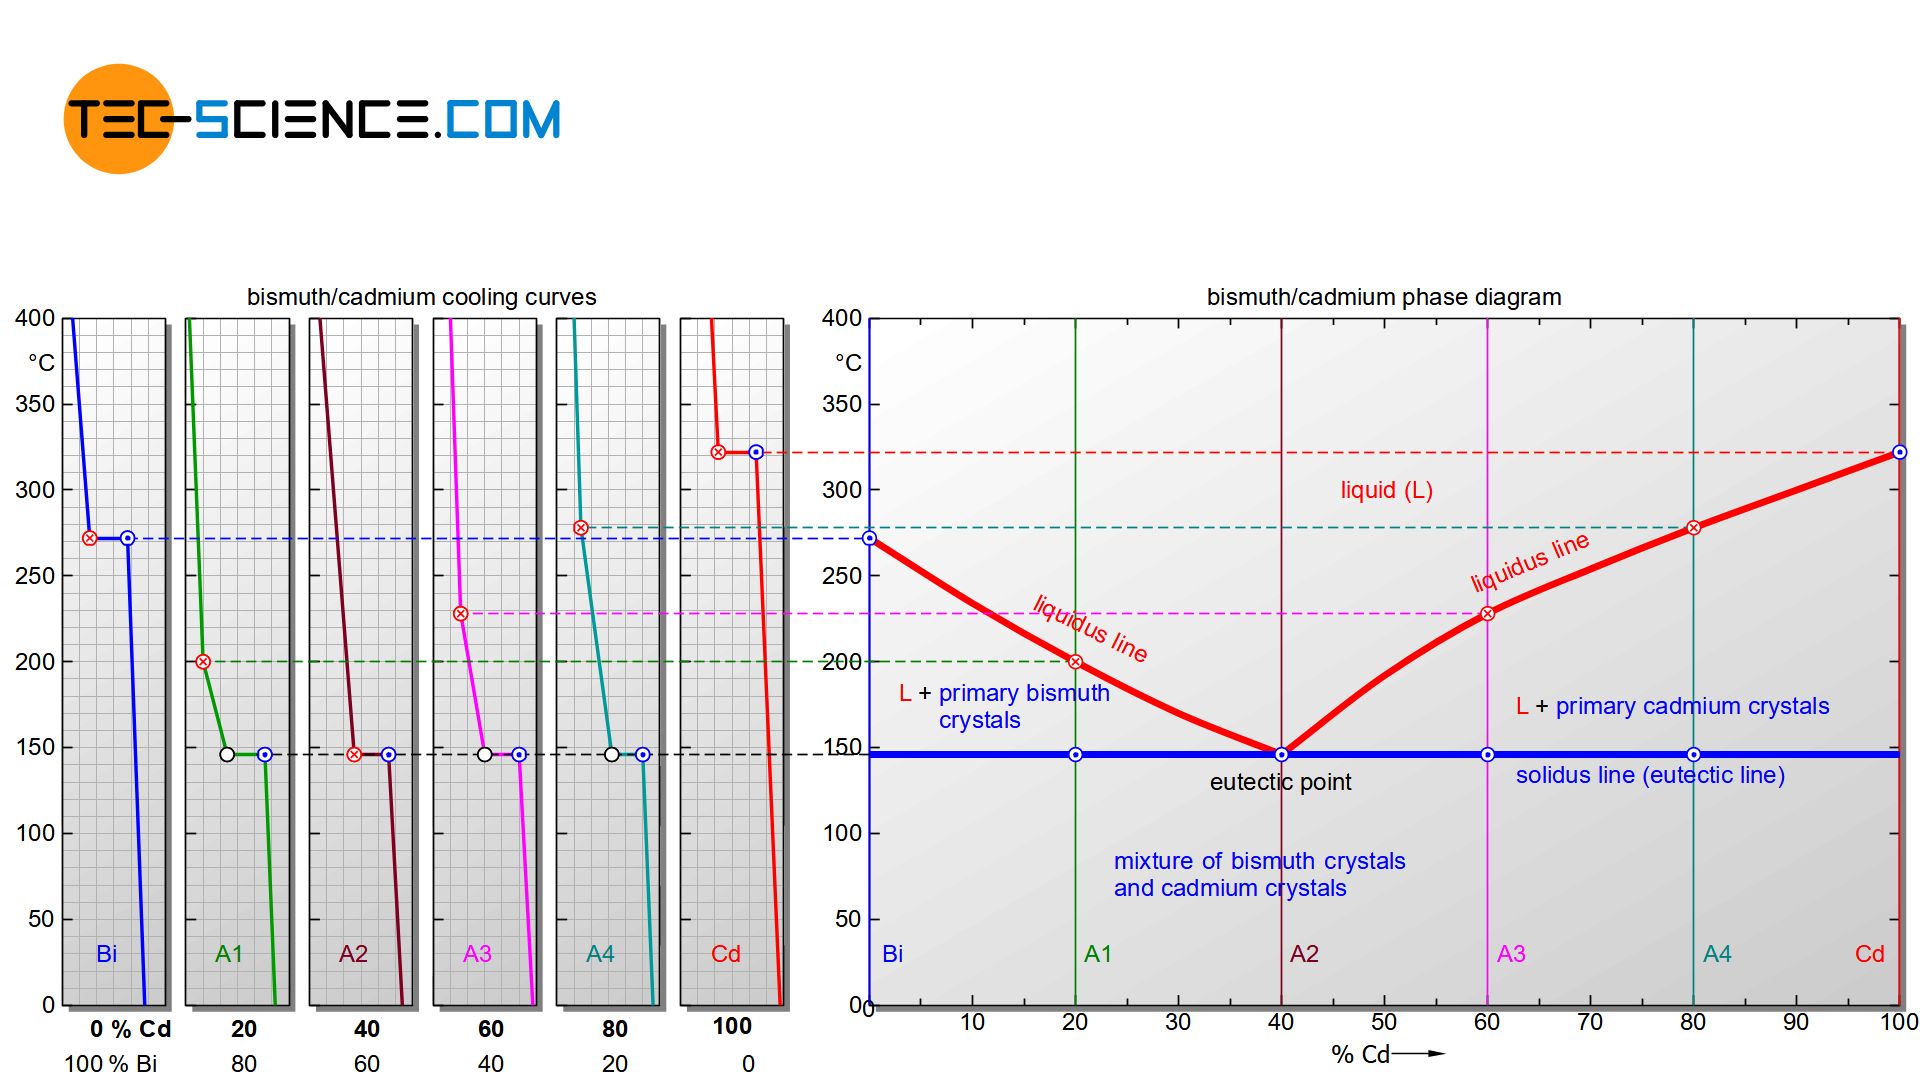
It can be seen that the liquidi start to fall off from the respective pure substances. Obviously, the start of solidification is shifted to low temperatures by the presence of the other substance. The falling lines finally meet at a common point. This particular point is also known as the eutectic point.
The Solidus, however, with the exception of the pure substances, is always at the same temperature regardless of the alloy concentration. Even if a different start of solidification results for each alloy, the end of solidification for all alloys is always at the same temperature (here: 146 °C). The Solidus is often referred to as the eutectic line.
The actual crystallisation takes place between the liquidus and the solidus line. In this region, parts of the alloy are already solidified, while others are still in a liquid state (“mushy” state). These regions are therefore again two phase regions. Note that there is a two phase region to the right and to the left of the eutectic point.
Apparently, different atomic processes take place during the crystallization, which initially lead to a flattened cooling curve and finally end in a thermal arrest. The processes that lead to such behavior are explained in more detail in the following sections.
Real phase diagram (limited solubility)
The phase diagram above gives the impression that adding even the smallest concentration of cadmium or bismuth causes an immediate shift of the solidification end to 146 °C (see Solidus). Although the two substances are in principle not soluble in each other in the solid state, in reality small concentrations of one substance can be dissolved in the other substance.
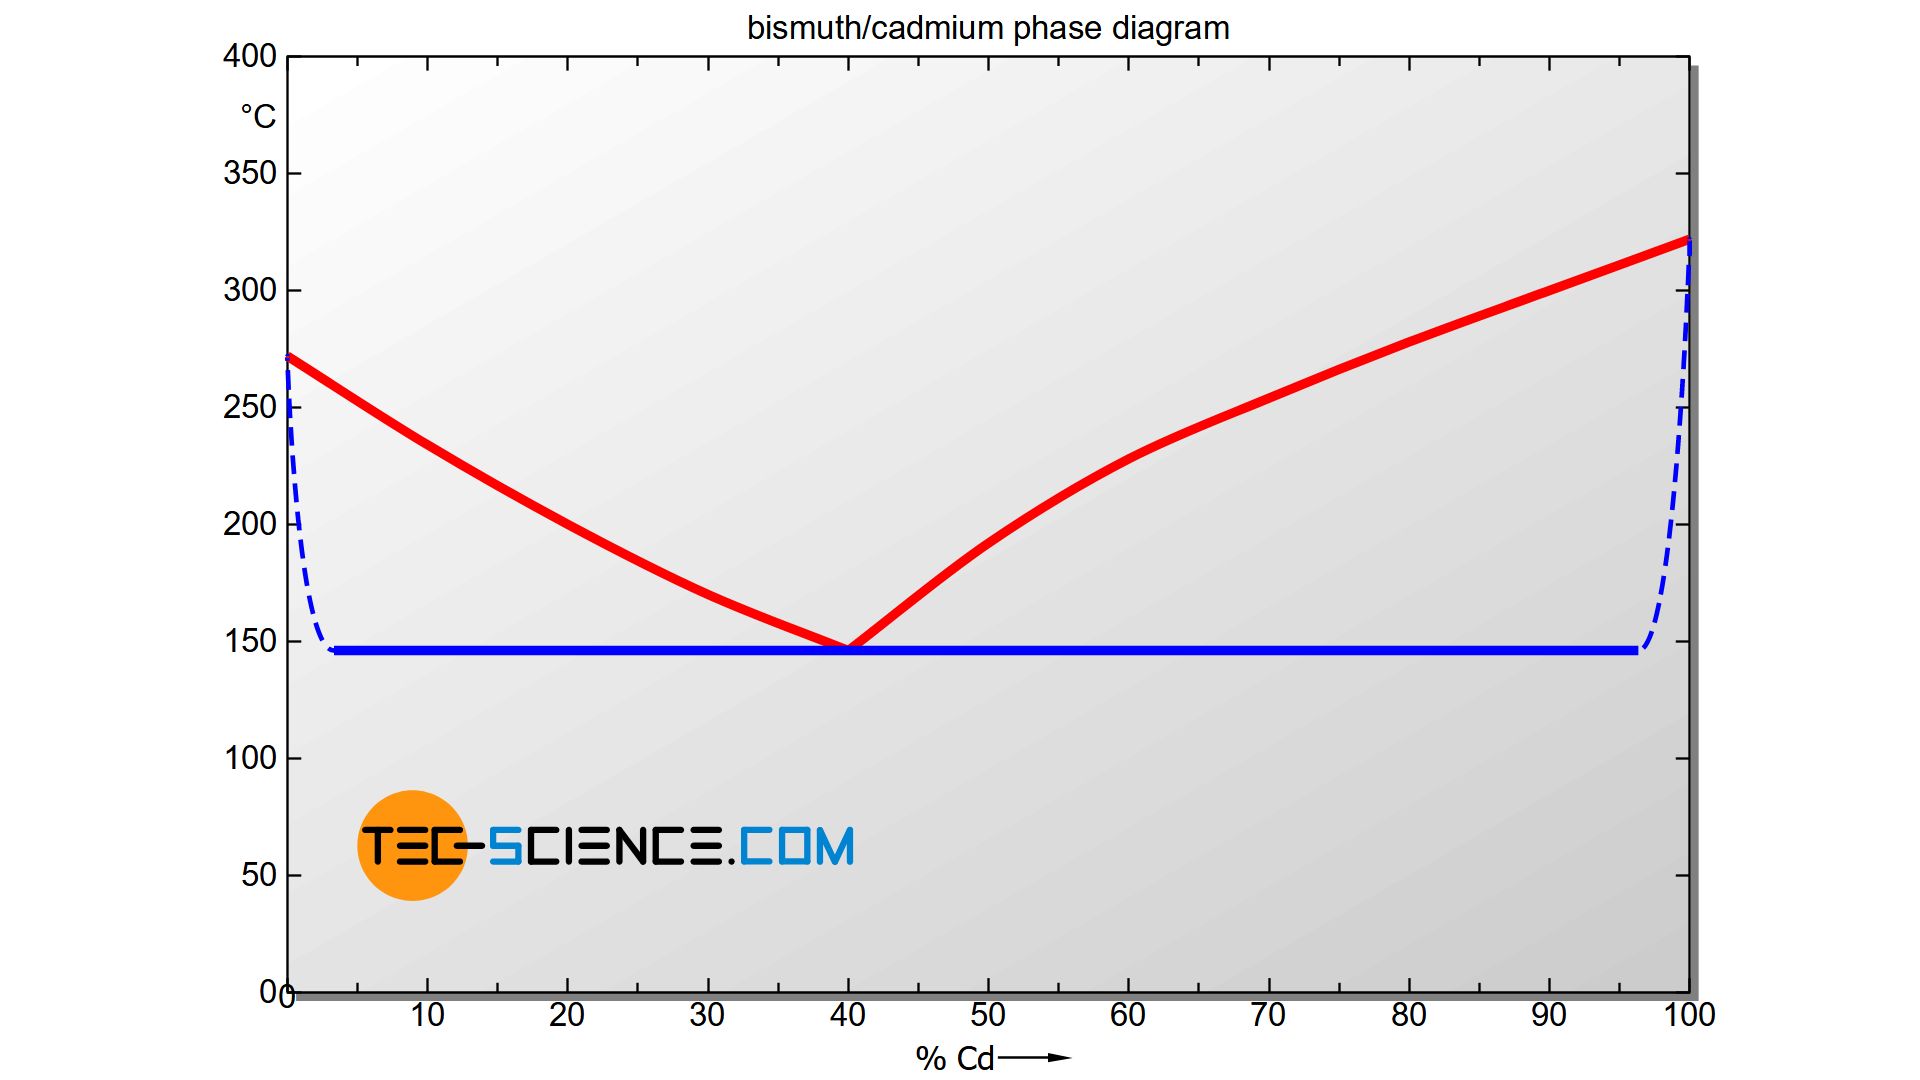
Therefore, the Solidus starting from the pure substances does not actually fall off immediately, but gradually (see dashed lines). Note that for a pure substance the liquidus line and solidus line must in principle coincide, since the start of solidification and the end of solidification are at a common temperature (thermal arrest). Therefore, the solidus line must converge to the liquidus line in the marginal areas.
Such a state diagram is already a preliminary step to the phase diagram of an alloy system with limited solubility of the components in the solid state. This type of alloy is described in more detail in a separate article.
How to read the phase diagram
Eutectic alloy
First, the formation of the microstructure is examined using the example of the eutectic alloy BiCd40. For better orientation, the considered alloy is drawn as a vertical line in the phase diagram.
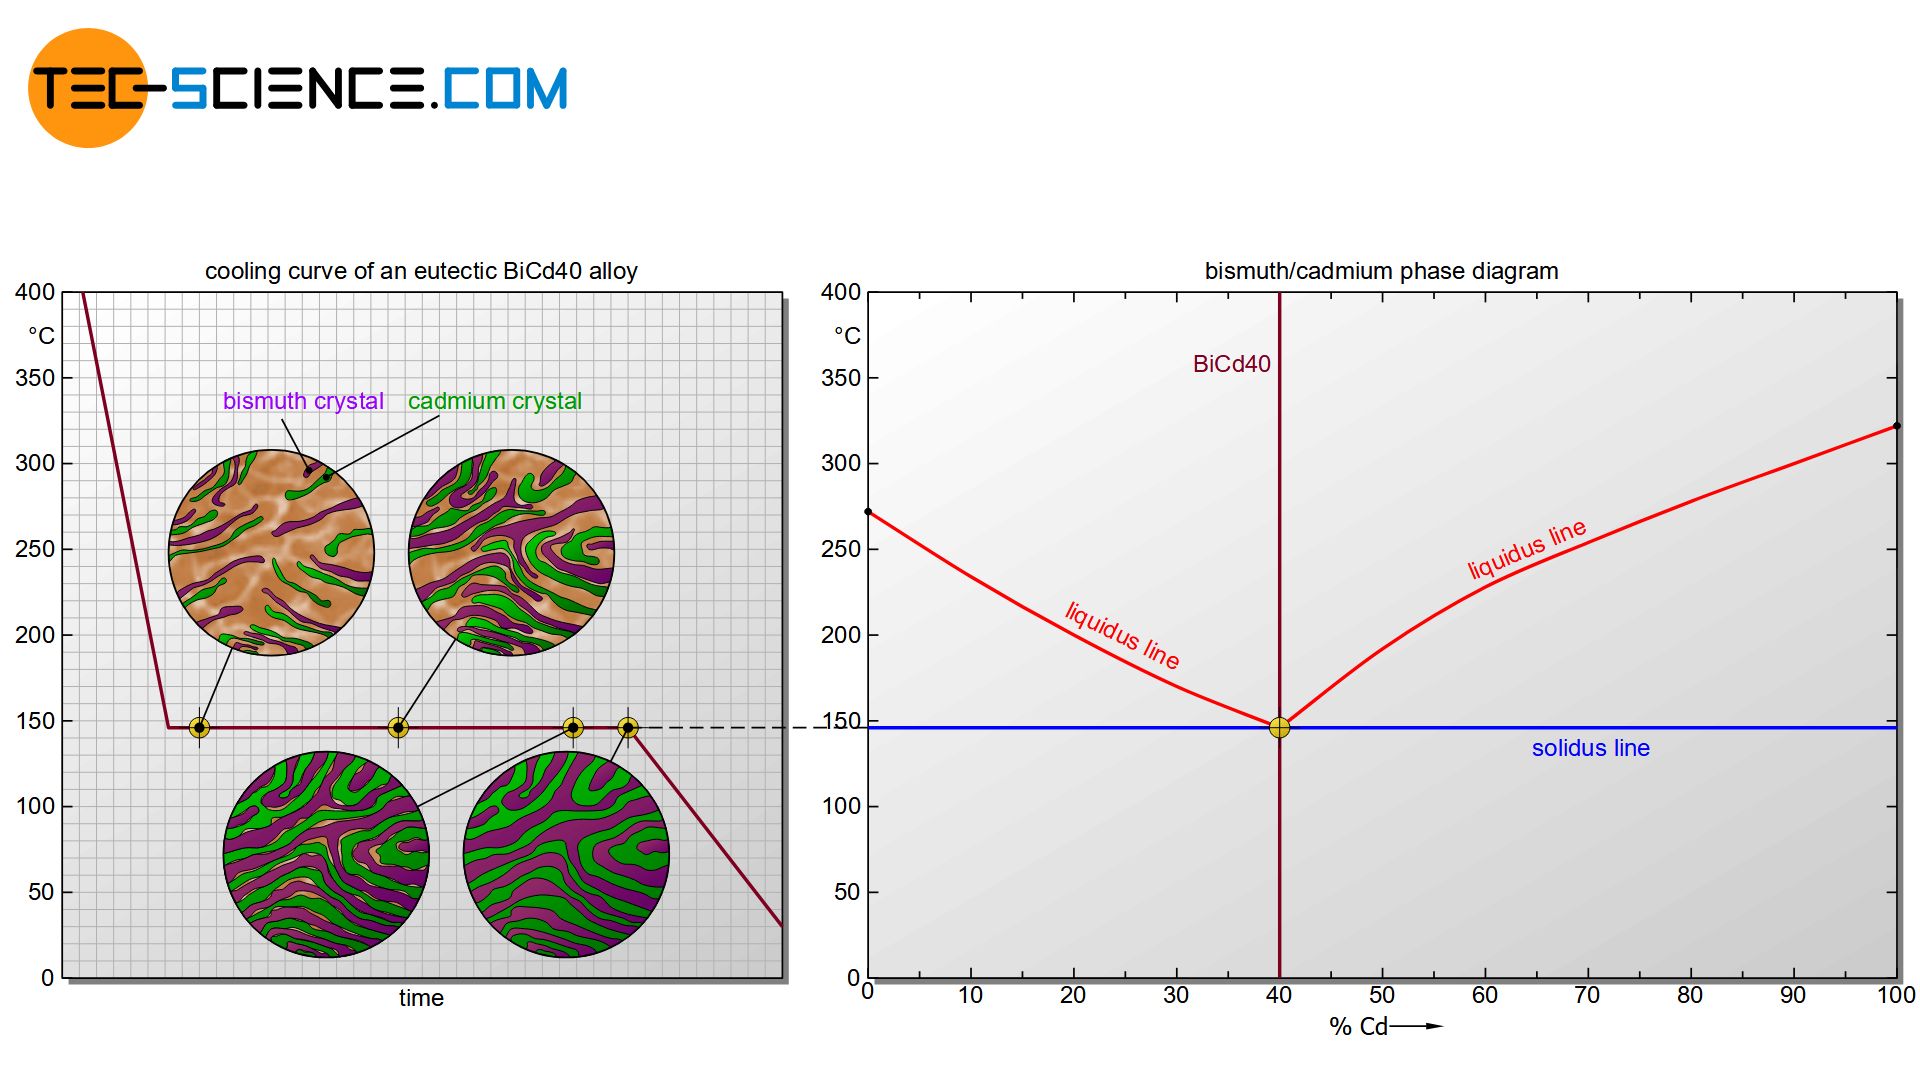
Starting from the liquid state, the cooling initially leads to a reduction in the kinetic energy of the bismuth atoms and cadmium atoms. Due to the very different chemical properties, the substances initially prevent each other from crystallizing. The solidification temperature of the alloy is therefore below that of the pure substances. In the case of the eutectic alloy, the start of solidification (liquidus line) has even been reduced to such an extent that it coincides in the phase diagram with the end of crystallization (solidus line). Eutectic alloys solidify like pure substances in a thermal arrest.
Eutectic alloys solidify at a constant temperature and have the lowest solidification temperature of the entire alloy system!
Once the temperature has finally dropped to the eutectic point, the undercooling has progressed so far (cf. solidification temperature of the pure substances of 271 °C or 321 °C vs. local temperature of 146 °C) that each substance start to crystallize for their own at constant temperature.
Due to the strong supercooling, many nuclei have formed. Around these nuclei, the respective atoms now attach themselves more and more and the microstructure begins to form. Each growing crystal consists of either pure bismuth atoms or pure cadmium atoms. Note, that there is insolubility in the solid state, i.e. the different atoms cannot be mixed in a common lattice structure. They are therefore forced to form their own pure crystals.
The individual crystallites continue to grow over time as further atoms attach to the lattice structure. The individual grains finally begin to collide towards the end of solidification. After the remaining melt has been completely consumed, the crystallization process is completed.
Due to the strong undercooling, a very fine-grained structure has developed, which is also called eutectic. As a structural component, the eutectic is thus a crystal mixture or phase mixture consisting of finely divided bismuth crystals and cadmium crystals. A further cooling only leads to a reduction of the temperature, the microstructure does not change any further. Hence, the formation of the microstructure is complete.
The melt is severely supercooled during crystallization. Diffusion processes in the melt and in the crystal are thus strongly inhibited. So movements of particles are relative slow and thus can cover only short distances. This usually leads to a fine lamellar crystal growth. Therefore, the grains of a eutectic alloy often have a lamellar structure rather than a roundish shape!
The eutectic is a finely distributed phase mixture (usually lamellar) which forms at a constant temperature out of the melt in the eutectic point!
Due to their very fine structure, eutectic alloys generally have very good strength and toughness values. This is due to the difficult dislocation movement over the fine lamellar structure. The lamellas serve as “obstacles” for the dislocations, so to speak.
Furthermore, eutectic alloys have the lowest melting point in the entire alloy system. This is precisely why they are ideal as casting materials or solders. The lower the processing temperature of a casting material, the lower the requirements on the respective casting moulds.
In addition, eutectic alloys do not solidify in a wide temperature range but in a temperature point, so that the shrinkage can be kept correspondingly low. Shrinkage is the reduction in volume during solidification.
Eutectic alloys have good strength and toughness properties and are often used as casting materials or solders!
Hypoeutectic alloy
In the following section, the microstructure formation using the example of the bismuth-cadmium alloy BiCd15 is described in more detail. Such an alloy, which is to the left of the eutectic point, is also called a hypoeutectic alloy.
Hypoeutectic alloys are alloys to the left of the eutectic point!
Hypoeutectic alloys always show both a flattening section as well as a and horizontal section (thermal arrest) within the cooling curve. Obviously different atomic processes take place during solidification, which are explained in more detail below.
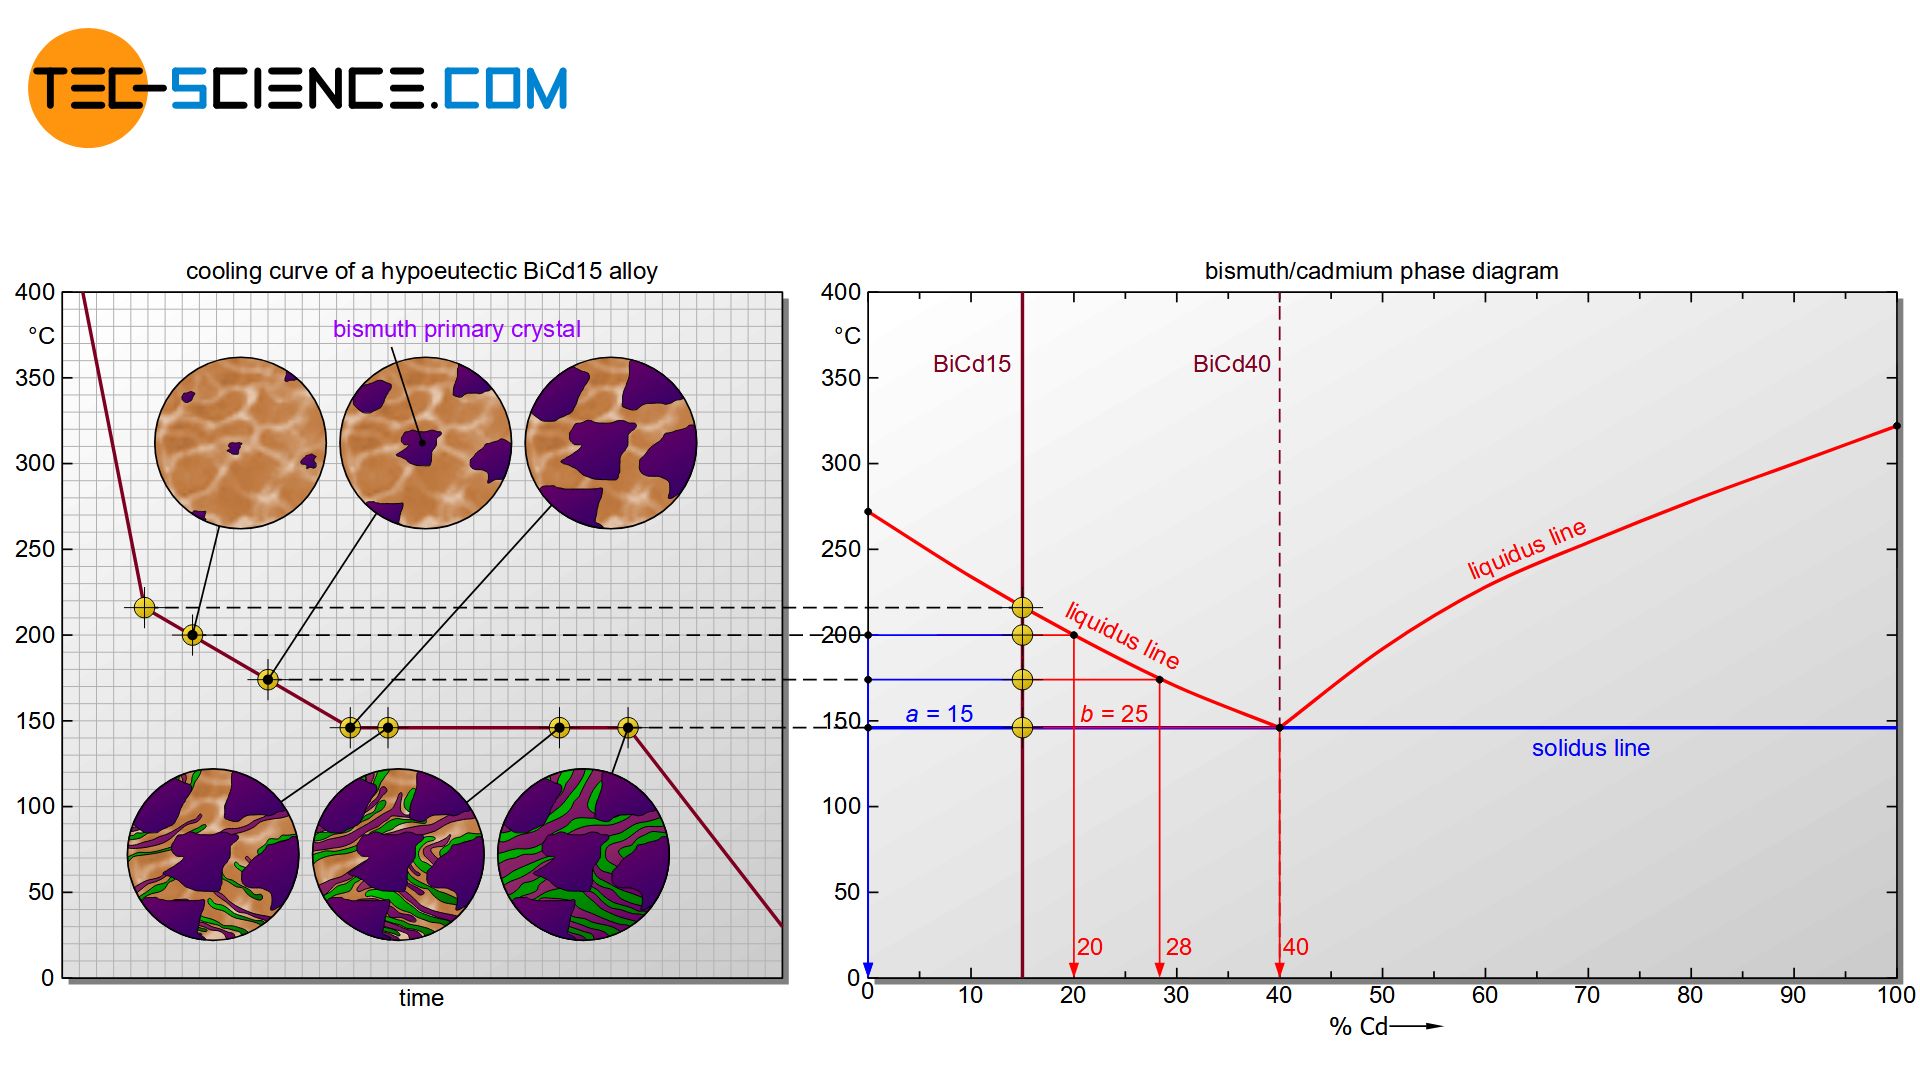
The mutual influence of the components initially has an effect on the start of solidification. Due to the presence of cadmium atoms in the melt, the formation of bismuth nuclei is initially suppressed. The solidification temperature of the alloy is therefore below the pure substance bismuth. After all, at some point supercooling has progressed so far that the cadmium atoms can no longer stop the start of crystallization of the bismuth atoms. The liquidus line is reached and the solidification process begins.
If the temperature falls below the liquidus line, individual nuclei are initially formed, which consist solely of bismuth atoms. The formation of cadmium nuclei is initially completely suppressed by the bismuth atoms due to the very different chemical properties!
With a hypoeutectic alloy, only crystals consisting of the host material (primary crystals) form during solidification in the two-phase region!
The bismuth nuclei grow into larger crystals as they cool further, as more and more bismuth atoms accumulate from the melt. These crystallites consist only of bismuth atoms, since cadmium cannot be dissolved in the bismuth crystal structure due to the insolubility of the components. Since bismuth is obviously the first to crystallize out of the melt during this solidification process, the resulting bismuth crystals are also called primary bismuth crystals (Bipc).
With further cooling, more and more bismuth atoms from the residual melt attach themselves to the crystals already present. As a result, the concentration of bismuth atoms in the residual melt decreases or rather the cadmium content of the melt increases permanently.
The cadmium concentration in the residual melt (L) can be read off – as with solid solutions – by drawing a perpendicular line onto the concentration axis at the corresponding temperature (here: ~20 % at ~200 °C).
The composition of the primary bismuth crystals (Bipc) can also be determined in the same way. Obviously one get a cadmium content of 0%; because it is a bismuth crystal, consisting of 100% bismuth. Note that the corresponding phase boundary must always be approached for drawing the perpendicular line – in this case, the phase boundary of the primary crystal is 0% cadmium and thus 100% bismuth.
By drawing a perpendicular line during further cooling, the increase in the cadmium content due to the increased excretion of bismuth in the residual melt becomes directly visible in the phase diagram. The cadmium content of the residual melt at 175 °C has already risen to approx. 28 %.
The cadmium content in the residual melt is thus increasingly approaching the eutectic composition with 40 % cadmium. After all, the residual melt at 146 °C has just reached the eutectic composition of 40 % cadmium. The residual melt now behaves like the solidification of the eutectic alloy. The eutectic melt thus begins to solidify into the eutectic at a constant temperature (finely distributed bismuth and cadmium crystals).
After the eutectic melt has solidified into eutectic, the crystallization process is completed. In the solidified state, the microstructure finally consists of the previously precipitated primary bismuth crystals and the eutectic formed at last. A further cooling only leads to a reduction of the temperature, the microstructure does not change any further.
The microstructure of a hypoeutectic alloy consists of primary precipitated crystals of the base material which are embedded in a eutectic matrix!
Due to their special casting properties, mixed crystal alloys are also referred to as casting alloys. However, since the microstructure generally contains primary precipitated crystals and is therefore relatively heterogeneous, these casting alloys are only partially suitable for forming. Solid solution alloys, on the other hand, generally have a homogeneous structure, since the components – unlike crystal mixtures – are completely soluble in one another. Solid solution alloys therefore generally exhibit better forming properties and are also referred to as wrought alloys.
Hypereutectic alloy
The microstructure of a so-called hypereutectic alloy (e.g. BiCd80) is formed in an analogous way to a hypoeutectic alloy.
Hypereutectic alloys are alloys to the right of the eutectic point!
The only difference in the solidification process is that cadmium primary crystals (Cdpc) precipitate from the melt when the liquidus line is reached. This leads to a corresponding depletion of cadmium atoms in the residual melt. Finally, the concentration of bismuth in the melt at 146 °C will have fallen to the eutectic concentration of 40 %. Now the eutectic melt begins to solidify at a constant temperature to form the eutectic.
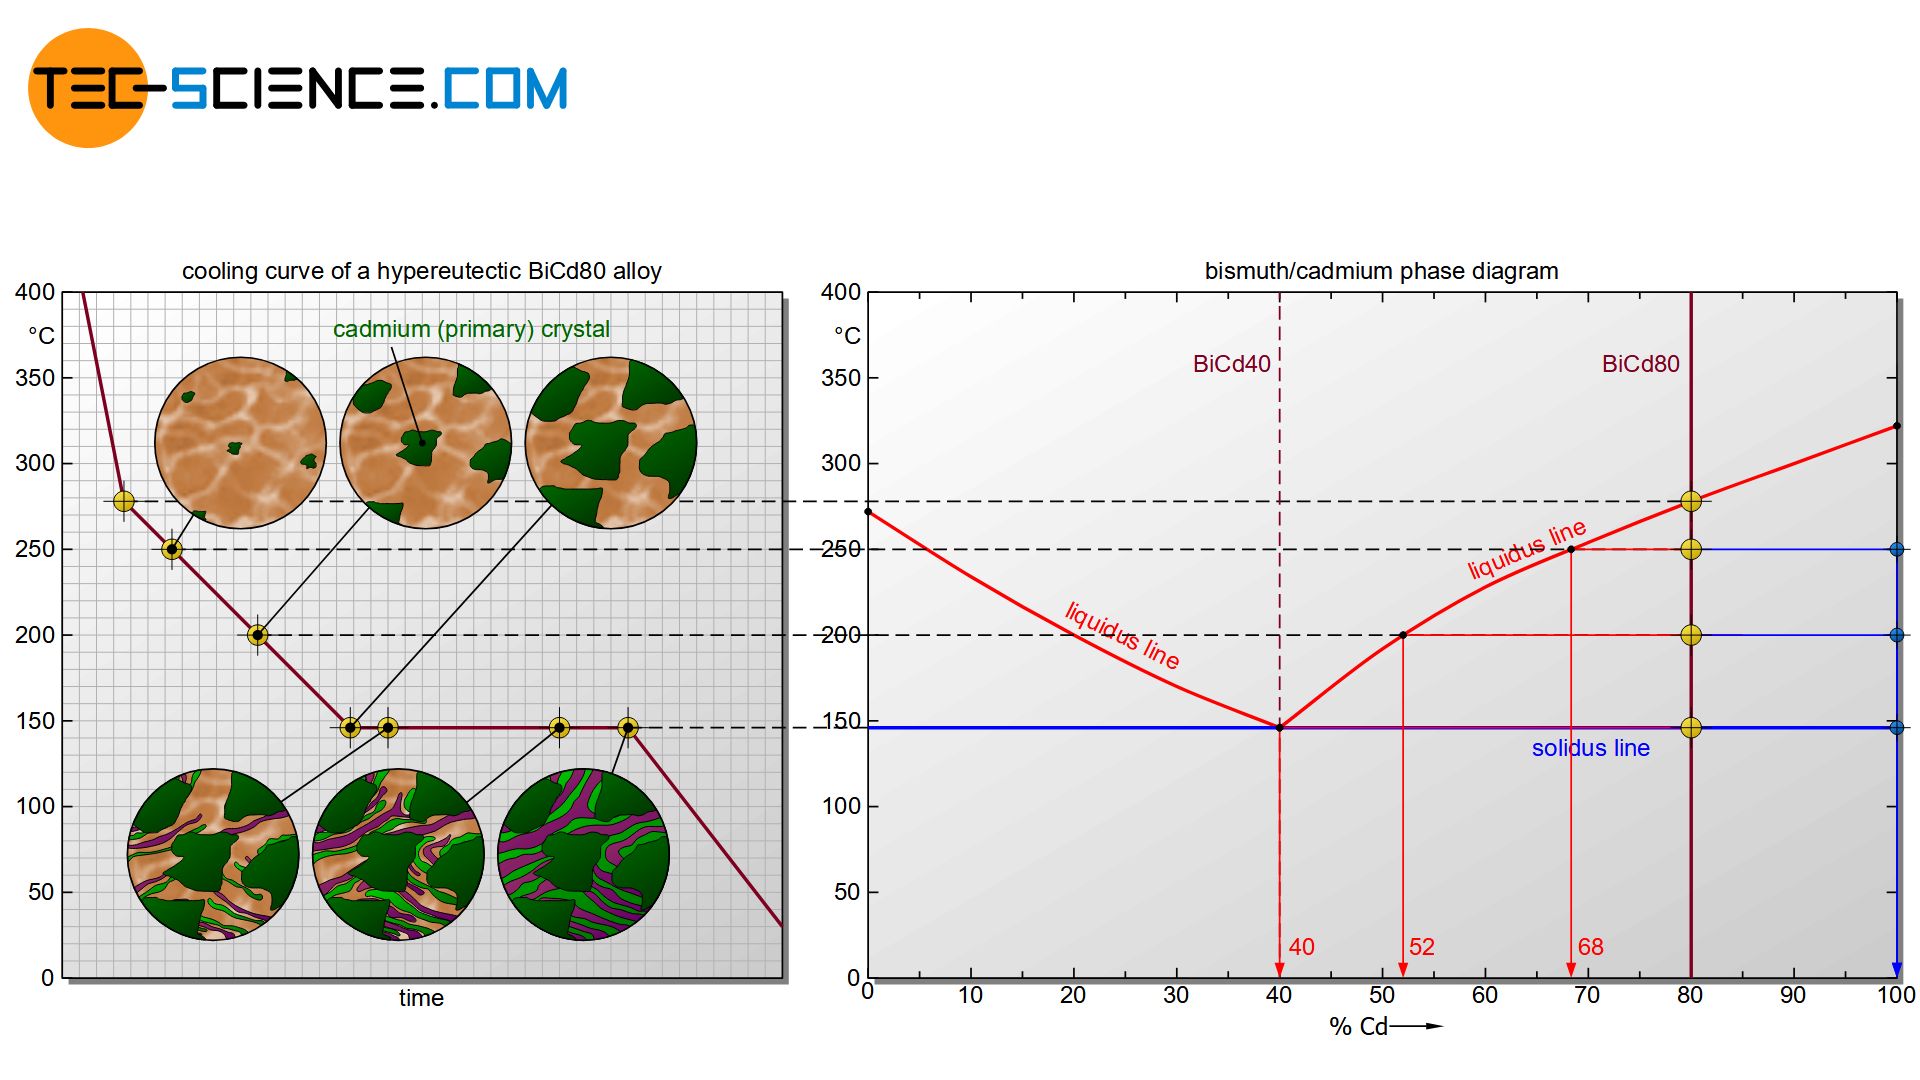
In the solidified microstructure of a hypereutectic bismuth-cadmium alloy, the primary precipitated cadmium crystals (Cdpc) are embedded in the eutectic.
The microstructure of a hypereutectic alloy consists of primary precipitated crystals of the alloying element which are embedded in a eutectic matrix!
Determination of phase fraction and microstructure fraction
In principle, the terms phase component and microstructural component must be strictly separated. A phase is a state of a substance which is characterized by a uniform chemical and physical structure (for further information see here)! Microscopically delimitable areas with certain physical properties, e.g. individual grains, are called microstructural components.
The eutectic, for example, is a microstructural component (microscopically visible with certain physical properties), but has no uniform chemical structure. Therefore, the eutectic is not a single phase but a phase mixture consisting of finely distributed cadmium crystals (1st phase) and bismuth crystals (2nd phase). The precipitated primary crystals, on the other hand, are both a microstructural component (microscopically visible with certain physical properties) and a phase (uniform chemical structure).
Phase fractions
In the two phase regions, the phases melt and primary crystals are present. As with solid solution alloys, the phase fractions can also be determined using the corresponding lever rule.
The hypoeutectic alloy BiCd15 at a temperature of 175 °C is taken as an example. Starting from the state point, the corresponding phase boundaries are first approached with a horizontal line (tie line). In the case of the melt this is the liquidus line and in the case of primary bismuth crystals the alloy concentration of 0 % cadmium (100 % bismuth).
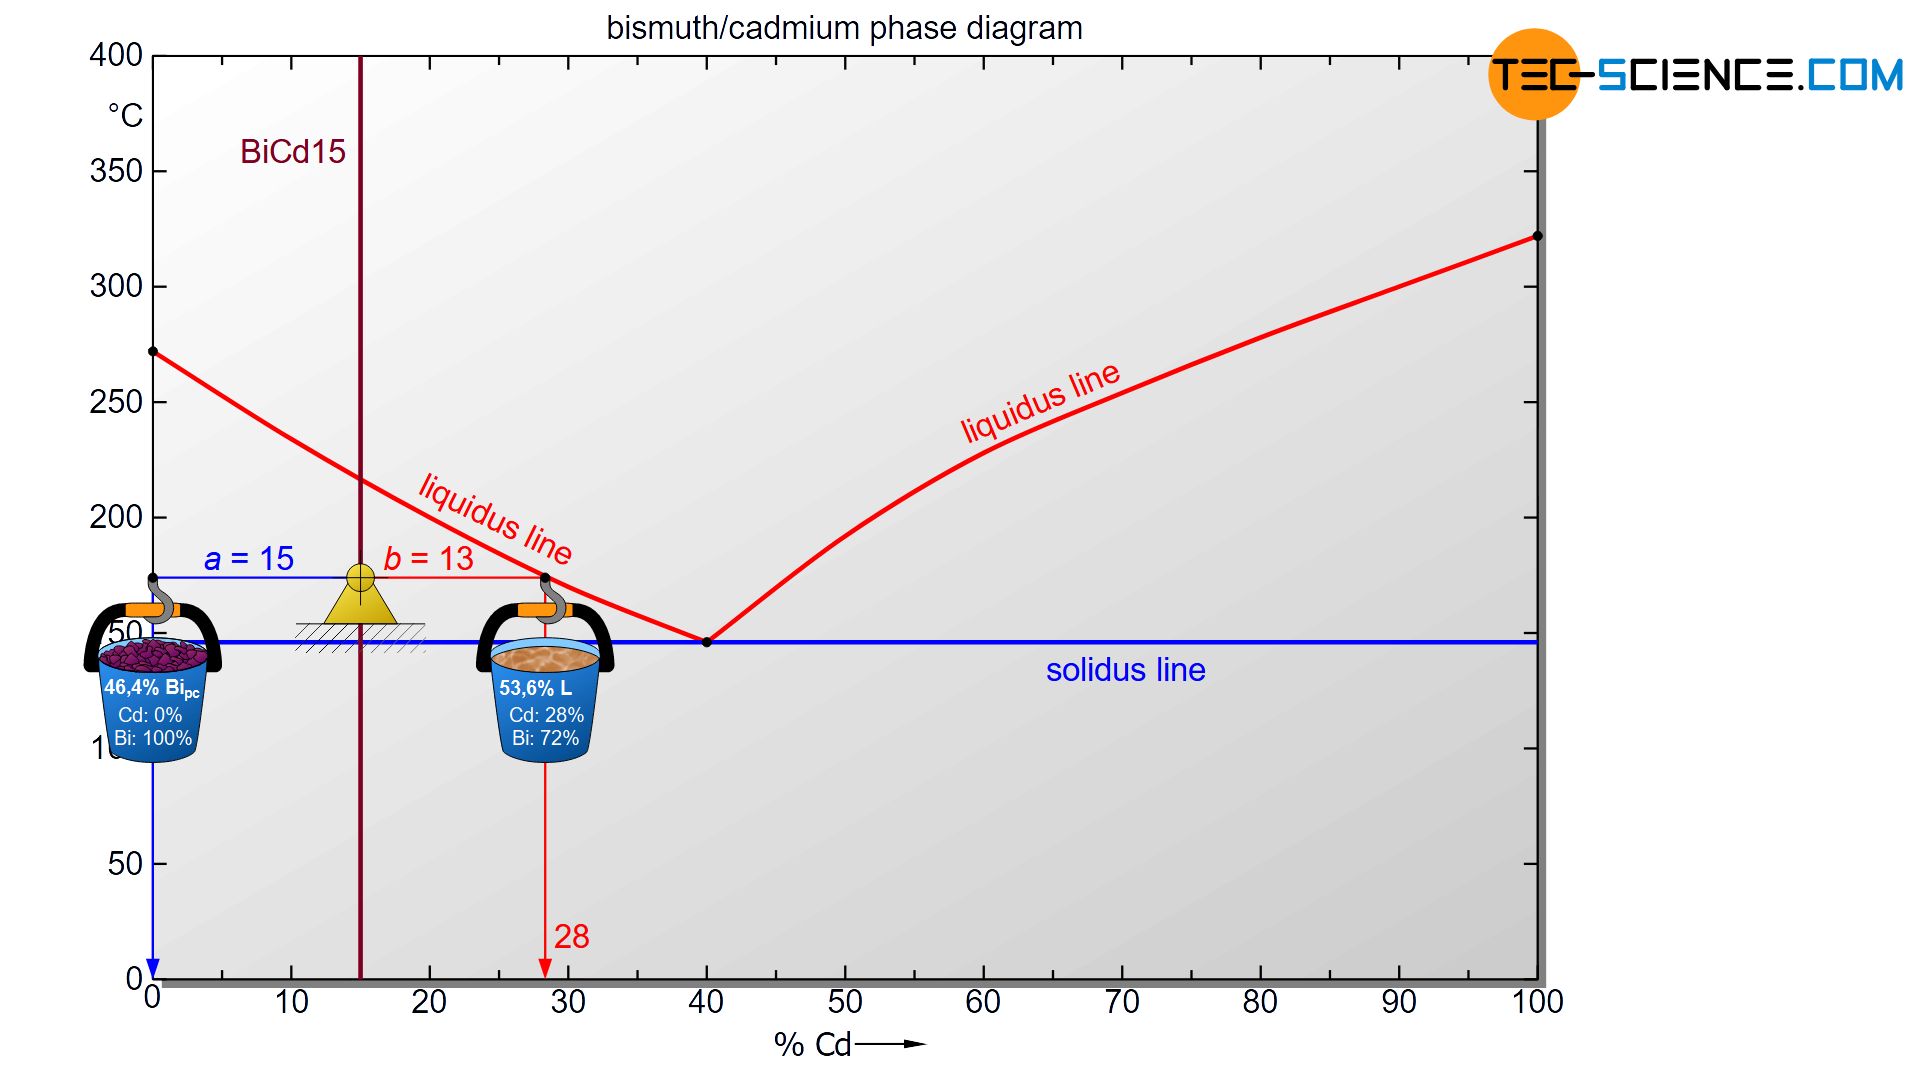
To determine the phase fractions of primary crystals (Bipc) and residual melt (L), the lever rule is now applied (“opposite lever arm divided by tie line length”). In the present case, the opposite lever arm of the primary bismuth crystals has a length of b=13 and the opposite lever arm of the melt a length of a=15. Thus the tie line has a total length of a+b=28. These values can now be used to determine the phase fraction of the primary crystals and the melt:
\begin{align}
\underline{Bi_{pc}} = \frac{b}{a+b} \cdot 100 \text{ %} = \frac{13}{28} \cdot 100 \text{ %} = \underline{46.4 \text{ %}} \\[5px]
\underline{L} = \frac{a}{a+b} \cdot 100 \text{ %} = \frac{15}{28} \cdot 100 \text{ %} = \underline{53.6 \text{ %}} \\[5px]
\end{align}
For the present BiCd15 alloy, the phase fraction of solidified primary crystals at 175 °C is 46,4 %. The remaining 53,6 % is accounted for the liquid phase melt.
Microstructure fraction
If the BiCd15 alloy is completely solidified, then the phases bismuth and cadmium are present in the microstructure. While the primary excreted bismuth crystals form their own microstructural component, the eutectic matrix consists of a phase mixture (of cadmium and bismuth) as a further microstructural component.
In order to determine the fractions of the individual microstructural components, the lever rule can be applied again. Any state point below the solidus line is now considered. The exact temperature chosen is irrelevant, as the microstructure below the eutectic line does not change anyway. Analogous to drawing a line to the phase boundaries, the lever arms are now drawn up to the corresponding microstructural boundaries.
In the case of primary bismuth crystals, the microstructure boundary is identical to the phase boundary at 0%, since the primary crystals are both a structural component and a phase. However, as a phase mixture, the eutectic has a cadmium concentration of 40 %. This is why the microstructural boundary of the eutectic is also located there. The lever arm must therefore be drawn to the eutectic concentration to calculate the microstructural component.
Note: This procedure also results directly from the fact that the calculation of the phase fractions in the two phase region in the limiting case lies on the solidus line and from the residual melt finally the eutectic emerges. Therefore, for the calculation of the microstructural components, one can simply imagine a state immediately before the formation of the eutectic. In this state point, the phase melt then simply becomes the microstructural component eutectic.
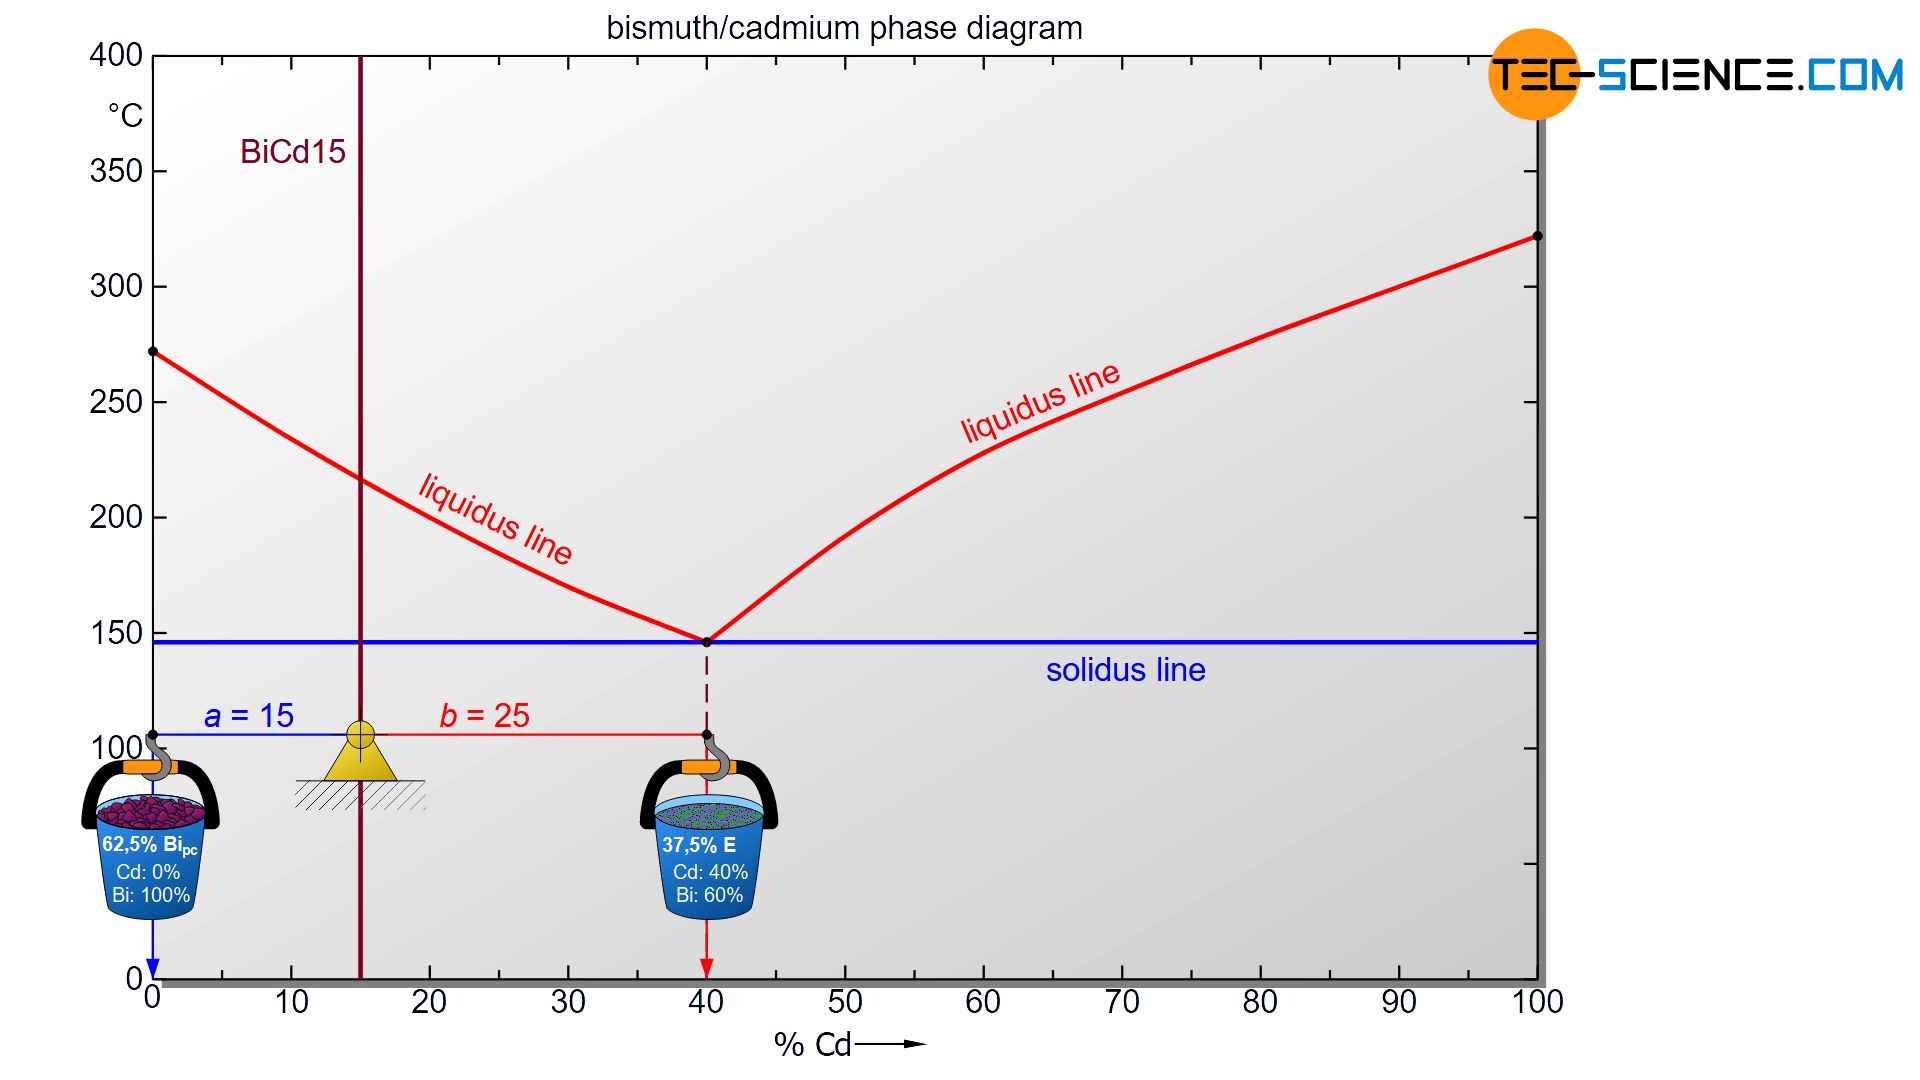
For the determination of the microstructure of primary crystals (Bipc) and eutectic (E) the lever rule is applied again. In the present case, the opposite lever arm of the primary bismuth crystals results to b=25 and the opposite lever length of the eutectic results to a=15. Thus the tie line has a total length of a+b=40. These values can now be used to determine the microstructure fraction of the primary crystals and the eutectic:
\begin{align}
\underline{Bi_{pc}} = \frac{b}{a+b} \cdot 100 \text{ %} = \frac{25}{40} \cdot 100 \text{ %} = \underline{62.5 \text{ %}} \\[5px]
\underline{E} = \frac{a}{a+b} \cdot 100 \text{ %} = \frac{15}{40} \cdot 100 \text{ %} = \underline{37.5 \text{ %}} \\[5px]
\end{align}
This results in a primary crystal content of 62.5% for the alloy BiCd15 at room temperature. The remaining 37.5% is accounted for the eutectic.
Excursus: Aluminium-silicon alloy for engine blocks
The determination of the primary crystals present in the microstructure is of great importance for many applications. A hypereutectic aluminium-silicon alloy is often used to cast an engine block (the eutectic composition is at 12.6% Si).
Due to the primary precipitated and very hard and thus wear-resistant silicon crystals, it is thus possible that the piston slides in the cylinder without additional reinforcements. For this it is however necessary that the microstructure consists of at least 5 % primary crystals.
With the understanding of the determination of the microstructure fractions, the required alloy concentration can then be determined. In this case, the alloy requires 17.0 % silicon (AlSi17).
Microstructure diagram
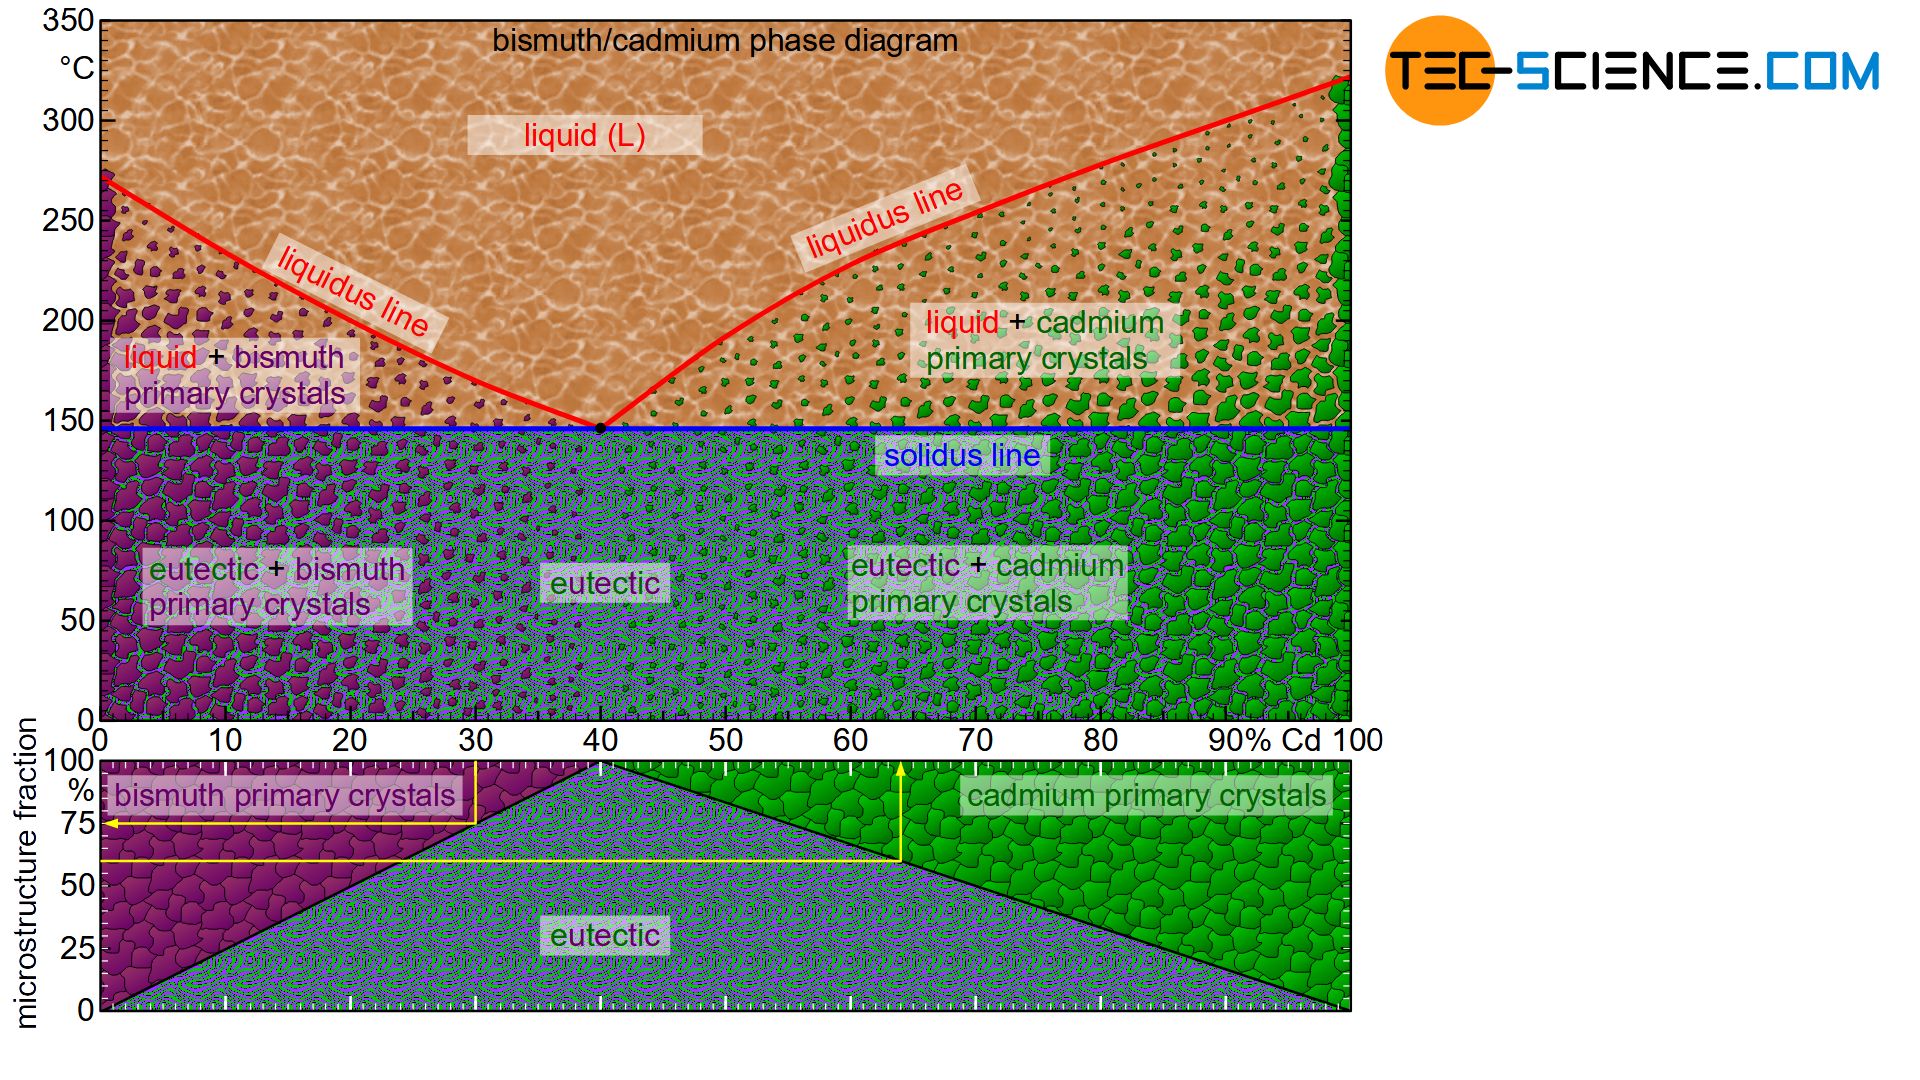
The phase diagram below schematically shows the individual phases of the bismuth/cadmium alloy system. Although the microstructure in the solidified state basically consists of a crystal mixture of cadmium and bismuth crystals, the microstructure can be classified more precisely depending on the alloy composition.
In eutectic alloys, the microstructure consists exclusively of eutectic, i.e. a very fine crystal mixture of both components. In the case of hypoeutectic alloys, the crystals of the host element, which were previously primary precipitated, also occur as microstructural component. In hypereutectic alloys, the primary precipitated crystals of the alloying element result as further microstructural components in addition to the eutectic.
Note, that an alloy concentration close to the eutectic composition reduces the grain size of the primary precipitated crystals. After all, the alloy concentration is already close to the eutectic point. Thus, only a small proportion of primary crystals is excreted in order to achieve the eutectic composition for complete solidification.
This also becomes clear quickly with the help of the lever rule for the determination of the microstructure fractions. The microstructure components shift linearly with the change of the fulcrum of the imaginary balance scale and thus the alloy concentration.
For example, the “pivot point” of a 20 % cadmium alloy is located exactly in the middle of the tie line. The solidified microstructure thus consists in equal mass fractions of primary bismuth crystals and eutectic. With increasing cadmium content, the balance shifts more and more to a larger fractions of eutectic. In 40 % cadmium, the microstructure consists of 100% eutectic. Conversely, a reduction in the cadmium content leads to a shift in the equilibrium towards a larger primary crystal content. At 0% cadmium, the structure is no longer eutectic but consists of 100% bismuth crystals. This results in a linear relationship between the cadmium content and the corresponding microstructural components.
The fractions of the microstructure components is shown below the phase diagram in the figure above. In this way, the fractions of the respective microstructural components can be determined easily on the basis of the alloy concentration. Such a representation of the microstructural fractions as a function of the alloy concentration is also referred to as a microstructure diagram.
The 30 % cadmium alloy is considered as an example. According to the microstructure diagram, 75 % of the microstructure consists of eutectic and 25 % of primary bismuth crystals.
Conversely, the required alloy concentration can also be determined from the microstructure diagram for a desired primary crystal content. If, for example, 25 % of the solidified structure is to consist of primary cadmium crystals (correspondingly 75 % of eutectic), the diagram shows the required alloy concentration of 55 % cadmium.

")
